Regional Flavor Map
Map how taste changes across a region — dishes, ingredients, and techniques, zone by zone.
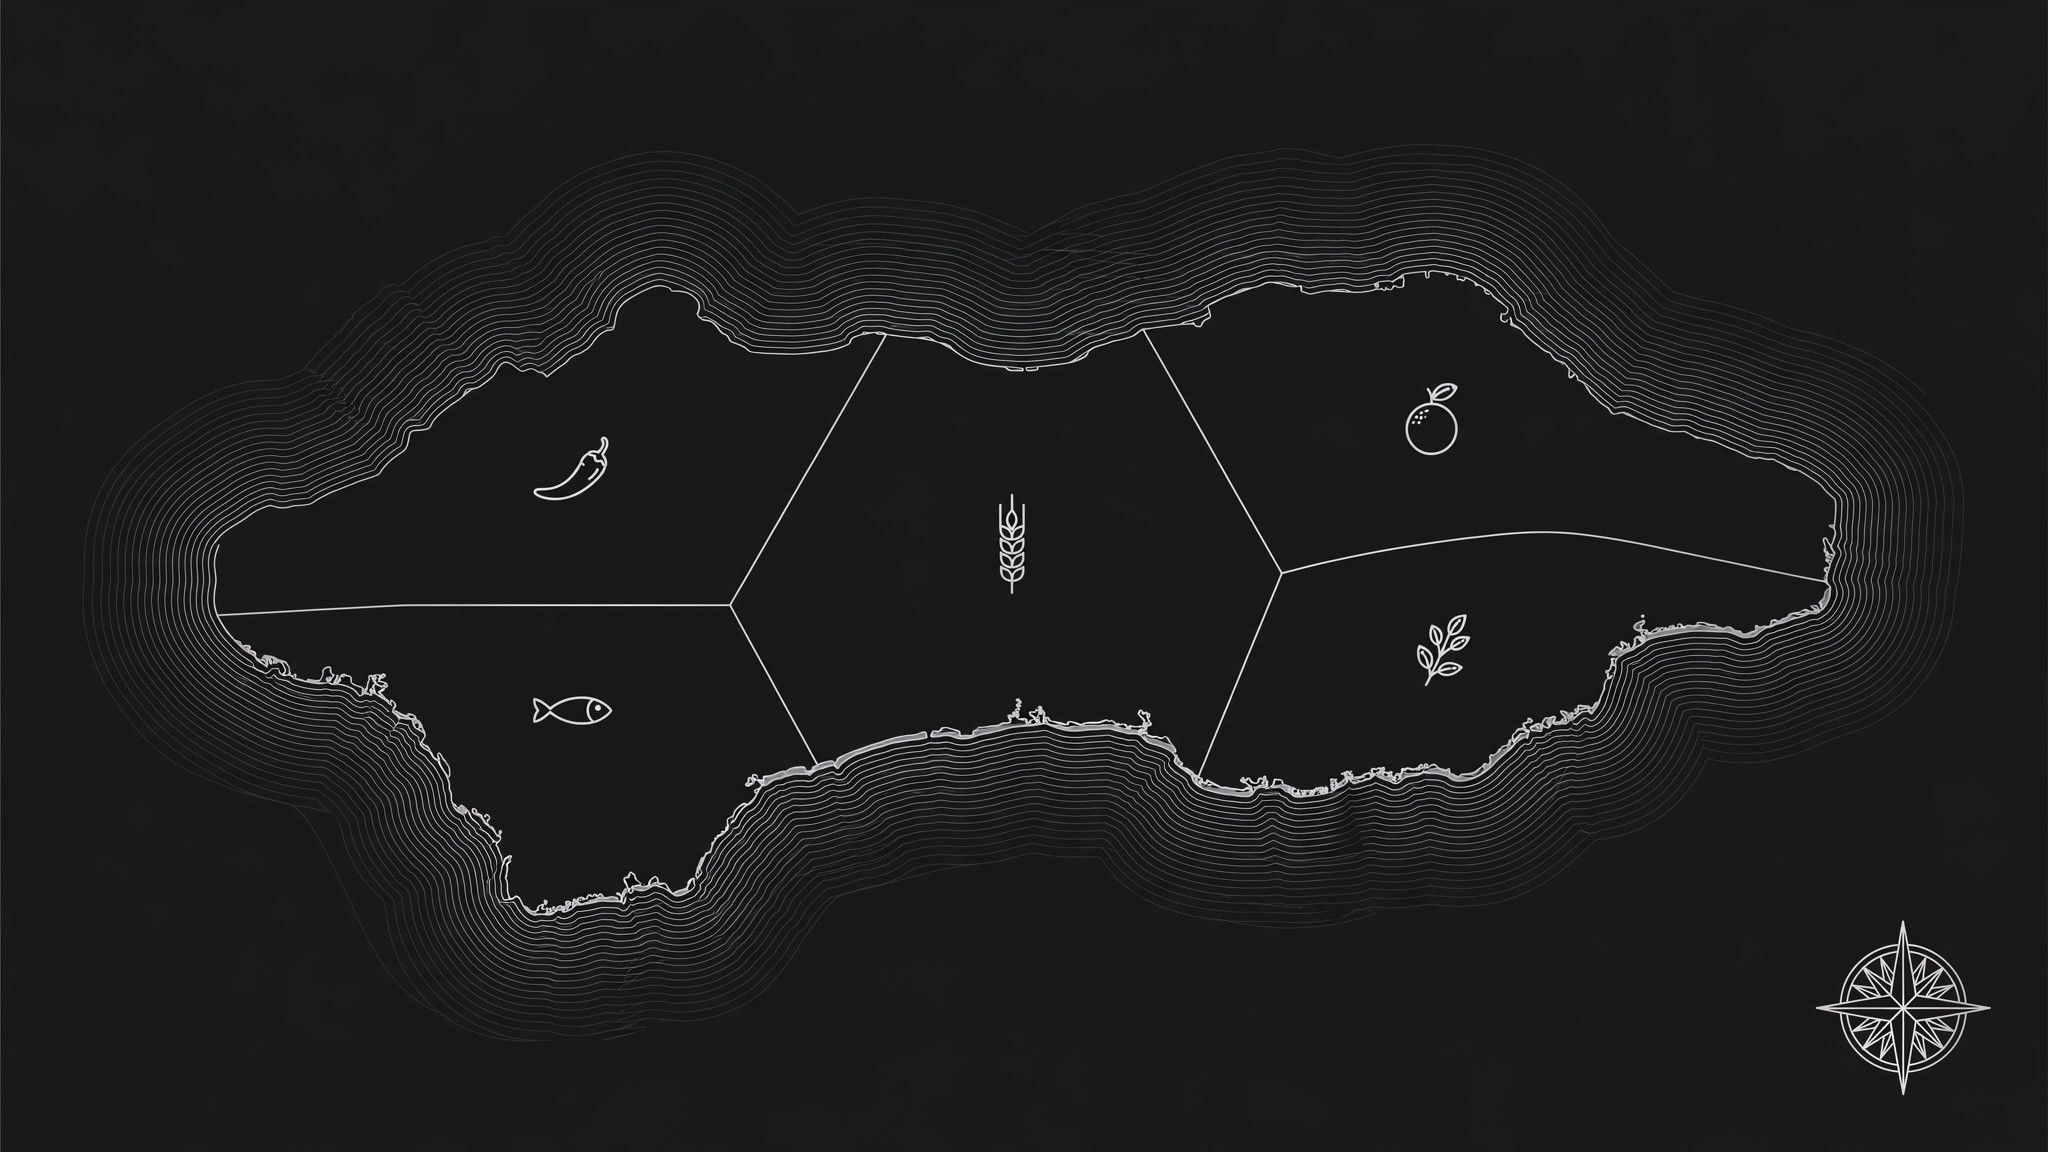
Turns your AI into a food-culture cartographer — collects a region's signature dishes, ingredients, and cooking techniques, organizes them by geography, and produces an illustrated flavor map that shows how taste changes across a place.
Install it in 3 steps
No sign-up. No CLI tools. Pick your AI, copy one line, paste it over.
Prefer doing it yourself? Buy the skill ($4.99), download the ZIP from your checkout confirmation, unzip it into the directory shown above, restart your AI session — same result. Already bought it? Your AI assistant can download it for you.
What’s inside
One SKILL.md (the playbook) + one starter template. A preview:
Regional Flavor Map
When to use
- You run a food publication, travel guide, or restaurant brand and want a visual that explains a region's cuisine at a glance
- You're planning a food trip and want to know what to eat where, instead of a generic "best restaurants" list
- A tourism board, market, or food festival needs a poster or web graphic that makes local food culture legible to visitors
- You're writing a cookbook chapter on a region and need a map that ties dishes to the places that made them
- A classroom or museum exhibit needs a one-page visual showing how geography shapes what people eat
Workflow
- Define the region and its boundaries (input: region name + scope → output: map scope sheet)
Pick the region and draw its borders honestly: a province, a city and its surroundings, a river valley, a coastline. Decide the granularity up front — a country-level map shows broad zones; a city map can show neighborhoods and markets. Write down what counts as "in" and what's excluded, because a flavor map that tries to cover everything ends up saying nothing. This scope sheet is the contract for every later step. - Gather dishes, ingredients, and techniques (input: scope sheet + research → output: dish inventory)
For each sub-area inside the region, collect: 3–8 signature dishes, the staple ingredients grown or traded there, and 1–2 defining techniques (smoking, fermenting, wok-frying, slow braising). Record a one-line origin note per dish — why it exists here (coastline fish, mountain herbs, trade-route spices, cold-climate preservation). Prefer dishes locals actually eat over dishes tourists photograph; if a dish is famous but rarely eaten at home, flag it as a showcase dish rather than a staple. - Find the geographic logic (input: dish inventory → output: flavor zones)
Group the inventory into zones that a reader can see on the map: coastal vs. inland, highland vs. lowland, north vs. south, or along a river or trade route. Each zone gets a flavor profile in plain words — "salty, sour, chili heat" or "buttery, mild, herb-forward" — plus its 2–3 most representative dishes. If two neighboring zones look identical on paper, merge them; a map with twelve indistinguishable zones is a list wearing a map costume. - Draft the map layout (input: flavor zones → output: map draft)
Place each zone on the map with its dishes, ingredients, and a small icon per zone. Keep labels short (dish name + one flavor word), keep the legend to one corner, and leave breathing room — a crowded map gets ignored. Put the most surprising zone (the one that breaks outsiders' assumptions) in the visual center or give it the strongest contrast, so the map teaches something instead of confirming clichés.
Template preview
Regional Flavor Map — Template
One region = one map. Fill this in before any drawing starts.
Map scope
Region: {name} | Boundaries: {what's in / what's out} | Granularity: {country / province / city / neighborhood}
Intended use: {poster / web graphic / cookbook chapter / classroom handout} Audience: {tourists / locals / students / readers}
Dish inventory
Showcase vs. staple: {dishes famous with tourists but rarely eaten at home — flag them}
Flavor zones (3–7)
Zone 1: {name — e.g. Coastal}
- Flavor profile: {plain words: salty, sour, chili heat…}
- Representative dishes: {2–3 dishes}