AI Services Market › Skills factory › Images › Infographic
$4.99 · No sign-inv1.0.0– views
Infographic
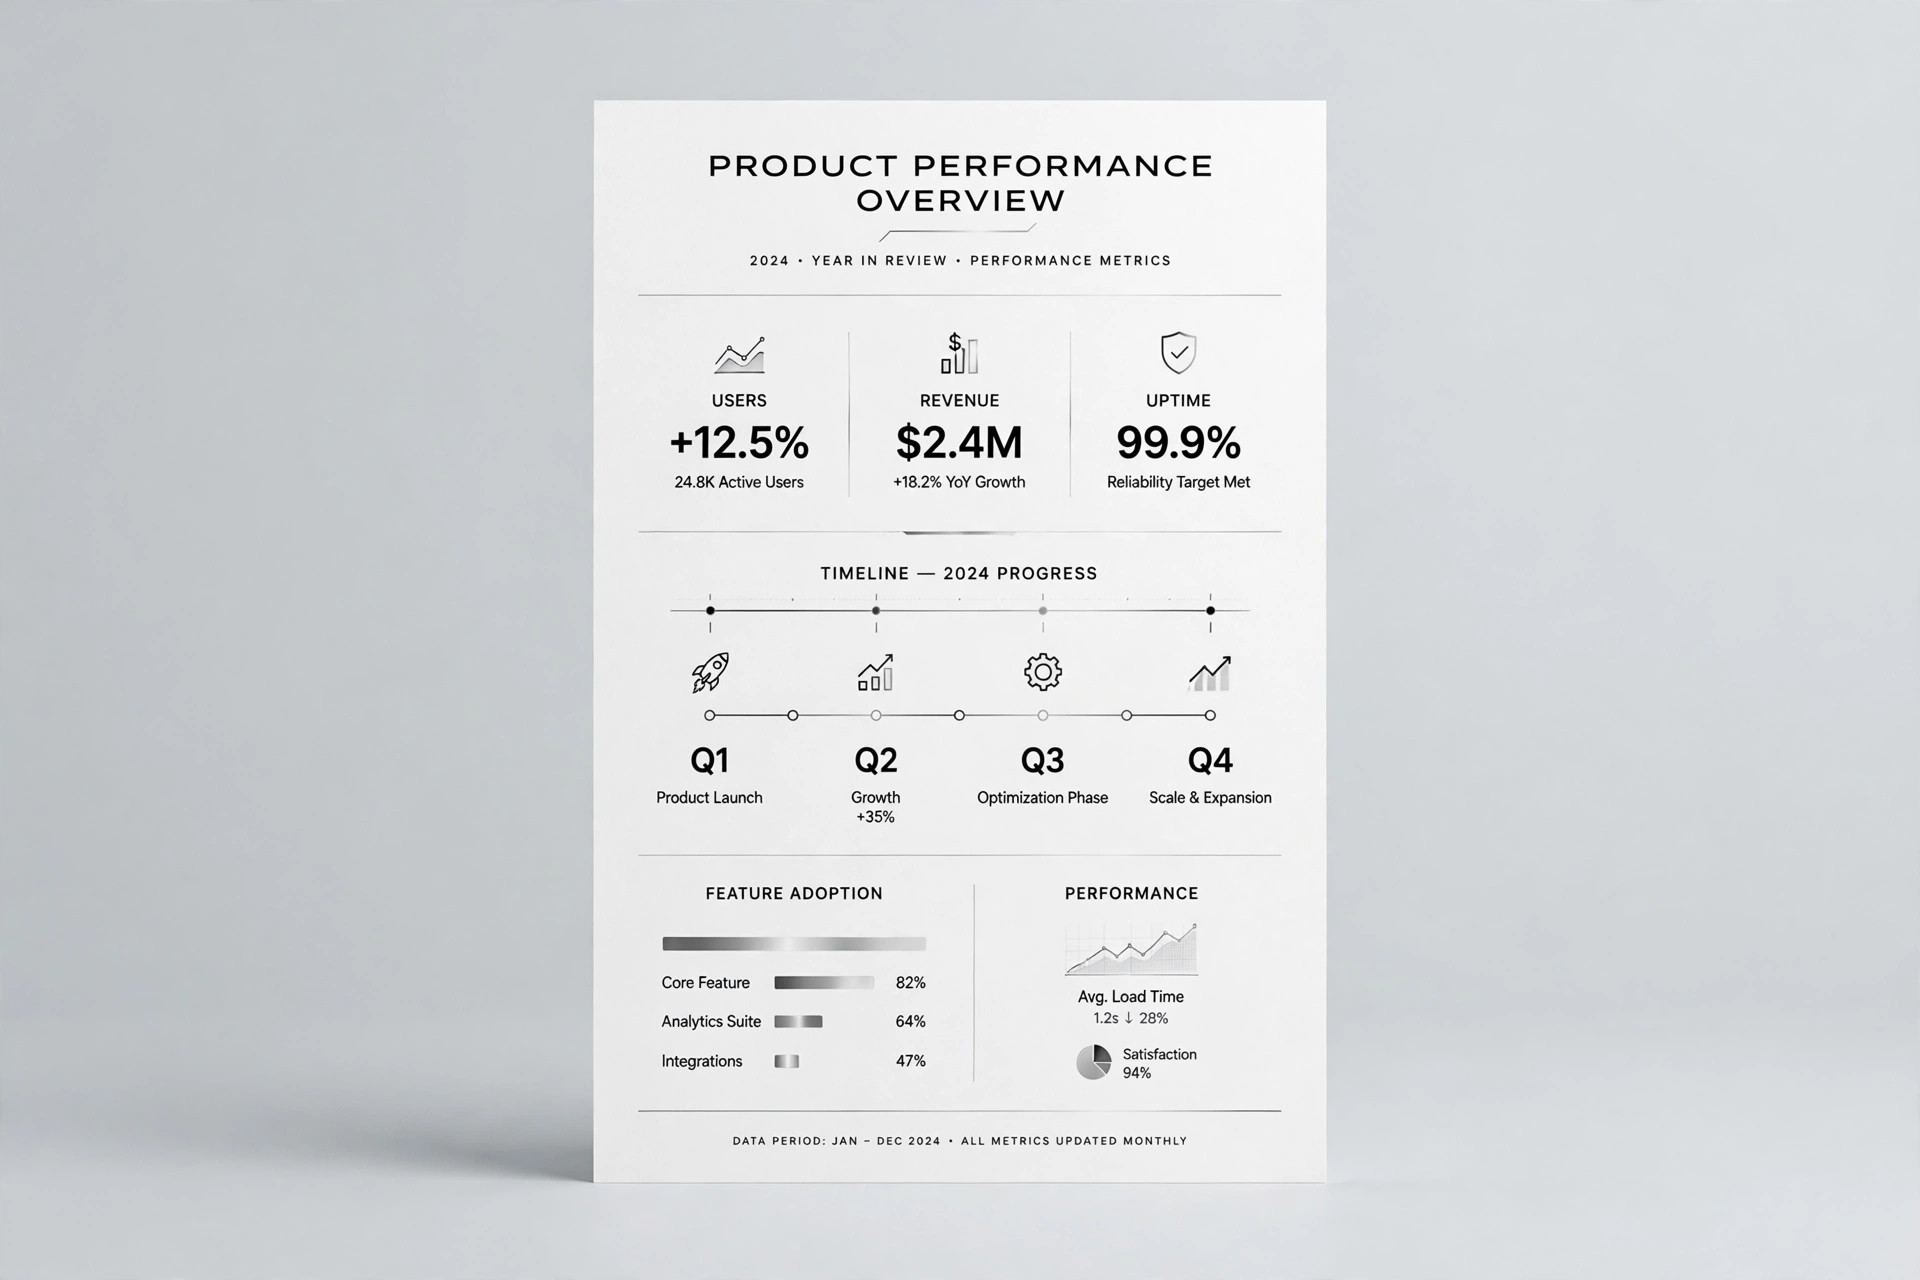
Turn a paragraph into one image — never fabricate data
The full text-to-infographic workflow: information layering, visual hierarchy, color, and a self-check list. No invented numbers, ever.
Best for
Teachers, marketers, report writers
Time needed
~20 min per graphic
Level
Beginner-friendly
Install it in 3 steps
No sign-up. No CLI tools. Pick your AI, copy one line, paste it over.
Prefer doing it yourself? Buy the skill ($4.99), download the ZIP from your checkout confirmation, unzip it into the directory shown above, restart your AI session — same result. Already bought it? Your AI assistant can download it for you.
Real-world proof
Real people did this exact job with AI agents.
Use case
Port Claude Code skills to Codex
Read case →Use caseFix app bugs, harden security and ship fixes autonomously
Read case →Use caseTurn a Telegram message into researched, designed social posts
Read case →What’s inside
One SKILL.md (the playbook) + one starter template. A preview:
Infographic
When to use
- The user drops in an article or a chunk of text and asks "make this a graphic" for their blog, socials, or a deck.
- The user has a set of numbers (sales, survey results, comparisons) and wants them understood at a glance.
- The user is writing an explainer or tutorial and needs one overview graphic that maps the whole piece.
- The user needs a "conclusion-first" one-pager for a report or pitch instead of a Word doc.
- The user already has a draft infographic and wants a quality review against a checklist.
Workflow
- Collect the material, lock the theme (Input: source text/data → Action: distill → Output: one-sentence theme + outline)
Read everything first, then say in one sentence what this graphic is really about; list 3–5 core points. If you can't state the theme clearly, don't move on — a fuzzy theme guarantees a messy graphic. - Layer the information (Input: outline → Action: split into three layers → Output: layered draft)
Headline layer: one conclusion sentence (a graphic gets exactly one core conclusion);
key-points layer: 3–5 points, each ≤ 20 words, facts only, no adjectives;
evidence layer: numbers, sources, footnotes in small print. Lock the words before touching visuals — never in reverse order. - Pin down every number (Input: each number in the draft → Action: trace → Output: data list)
Annotate every number with three things: the value, its definition (e.g. "YoY vs QoQ", reporting period), and its source. If the source text gives no source, mark "Source: user-provided, unverified" — never invent a plausible-looking number. This is the red line of this skill; see Notes. - Set the visual hierarchy (Input: layered draft → Action: rank weight → Output: layout sketch in words)
Give each layer a visual weight so the most important thing is biggest and seen first.
Rules: headline layer largest, topmost; key-points layer in colored/icon zones, one zone per point;
evidence layer smallest, at the bottom. One reading path only (top-to-bottom or left-to-right) — never make the reader guess where to look first. - Colors and charts (Input: layout sketch → Action: pick colors + chart types → Output: palette + chart list)
Palette: 1 primary + 1 accent + neutral base (white/light grey/cream), max 4 colors total. Match chart to data type, no exceptions: trends → line, shares → donut (≤ 5 categories), comparisons → bars, processes → arrow steps. Delete any decorative chart with no data behind it. - Produce and self-check (Input: finished prompt/layout → Action: generate + check off → Output: final or revision list)
Template preview
1. Layered draft skeleton (lock the words first, visuals later)
Headline layer (exactly 1 core conclusion for the whole graphic)
- Core conclusion: