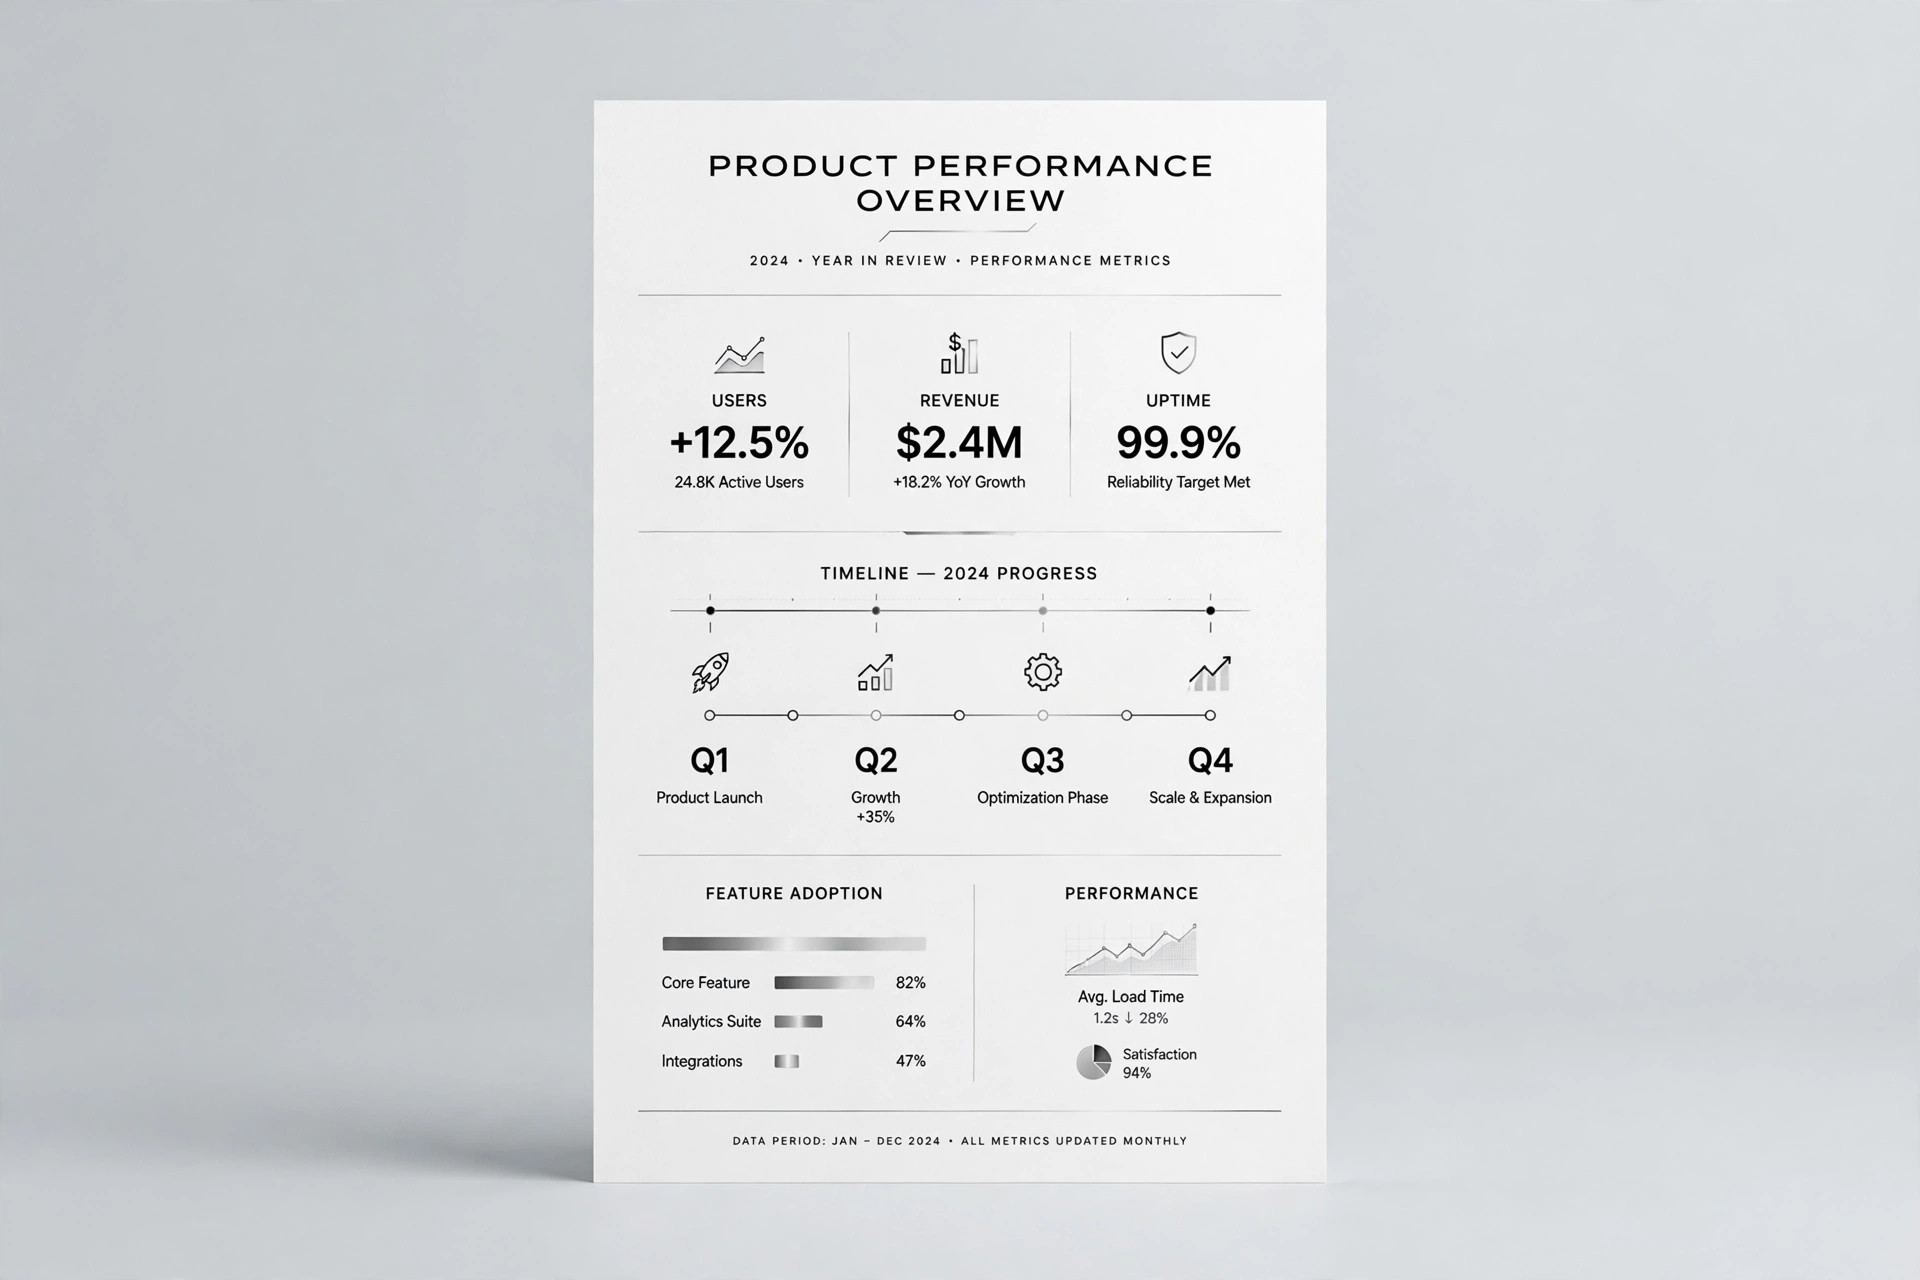
Paired Column Chart
Two bars per category, one comparison nobody can miss.
Turns your AI into a chart designer that builds paired column charts — two bars side by side per category, with honest scales, readable labels, and annotations that make the comparison impossible to miss.

Install it in 3 steps
No sign-up. No CLI tools. Pick your AI, copy one line, paste it over.
Prefer doing it yourself? Buy the skill ($4.99), download the ZIP from your checkout confirmation, unzip it into the directory shown above, restart your AI session — same result. Already bought it? Your AI assistant can download it for you.
What’s inside
One SKILL.md (the playbook) + one starter template. A preview:
Paired Column Chart
When to use
- You need to compare two series across the same categories — this year vs. last year, plan vs. actual, group A vs. group B
- A before/after story where each category has a "before" number and an "after" number
- A slide or report where the audience must see which series wins in each category at a glance
- You have a table with one category column and exactly two numeric columns to compare
- A dashboard panel where two metrics share categories and deserve equal visual weight
Workflow
- Shape the data (input: raw table → output: tidy comparison table)
Reduce the input to exactly three columns: one category column and two numeric columns with plain-language headers ("Planned" and "Actual", not "Series1" and "Series2"). One row per category, categories in a meaningful order — chronological, ranked by the gap, or ranked by size — never alphabetical by default. If the raw data has more than two numeric columns, split it into multiple charts rather than cramming extra series into the pairs. If a category is missing one of the two values, decide explicitly: show a gap marker, or drop the category — never silently plot zero. - Set the scale (input: tidy table → output: axis spec)
Start every value axis at zero — a truncated axis turns a 5% gap into a visual landslide and readers will not trust the chart again. Pick a round-number step (5, 10, 25, 50, 100) so gridlines land on numbers people can do arithmetic with. If the two series live on wildly different magnitudes (one in tens, one in thousands), do not force them onto one axis: normalize to an index, use per-unit values, or pick a different chart. State the unit once in the axis title ("Revenue, $ thousands"), not inside every label. - Pair the bars (input: axis spec → output: chart layout)
Place the two bars for each category adjacent with a small gap between the pair and a wider gap between categories, so the eye groups each pair first and scans across pairs second. Use two clearly distinct fills — one neutral (grey/silver) and one accent — with a legend that sits above the chart, not buried below it. Keep bars the same width, keep the gap between paired bars constant, and never use 3D effects, gradients, or shadows that change a bar's apparent height. If there are more than about 10 categories, switch to horizontal bars so the category labels stay readable.
Template preview
Paired Column Chart — Template
Fill in the three columns, then hand the table to the chart builder.
Data table
Category order: {chronological / ranked by gap / ranked by size} Missing values: {show gap marker / drop category} — never plot as zero
Axis spec
- Unit: {e.g. Revenue, $ thousands}
- Axis starts at: 0 (always)
- Gridline step: {5 / 10 / 25 / 50 / 100 — round number}
- Series magnitudes: {similar — one axis OK / very different — normalize or split}
Layout
- Orientation: {vertical (≤10 categories) / horizontal (11+ categories)}
- Series A fill: {neutral grey/silver}
- Series B fill: {accent}