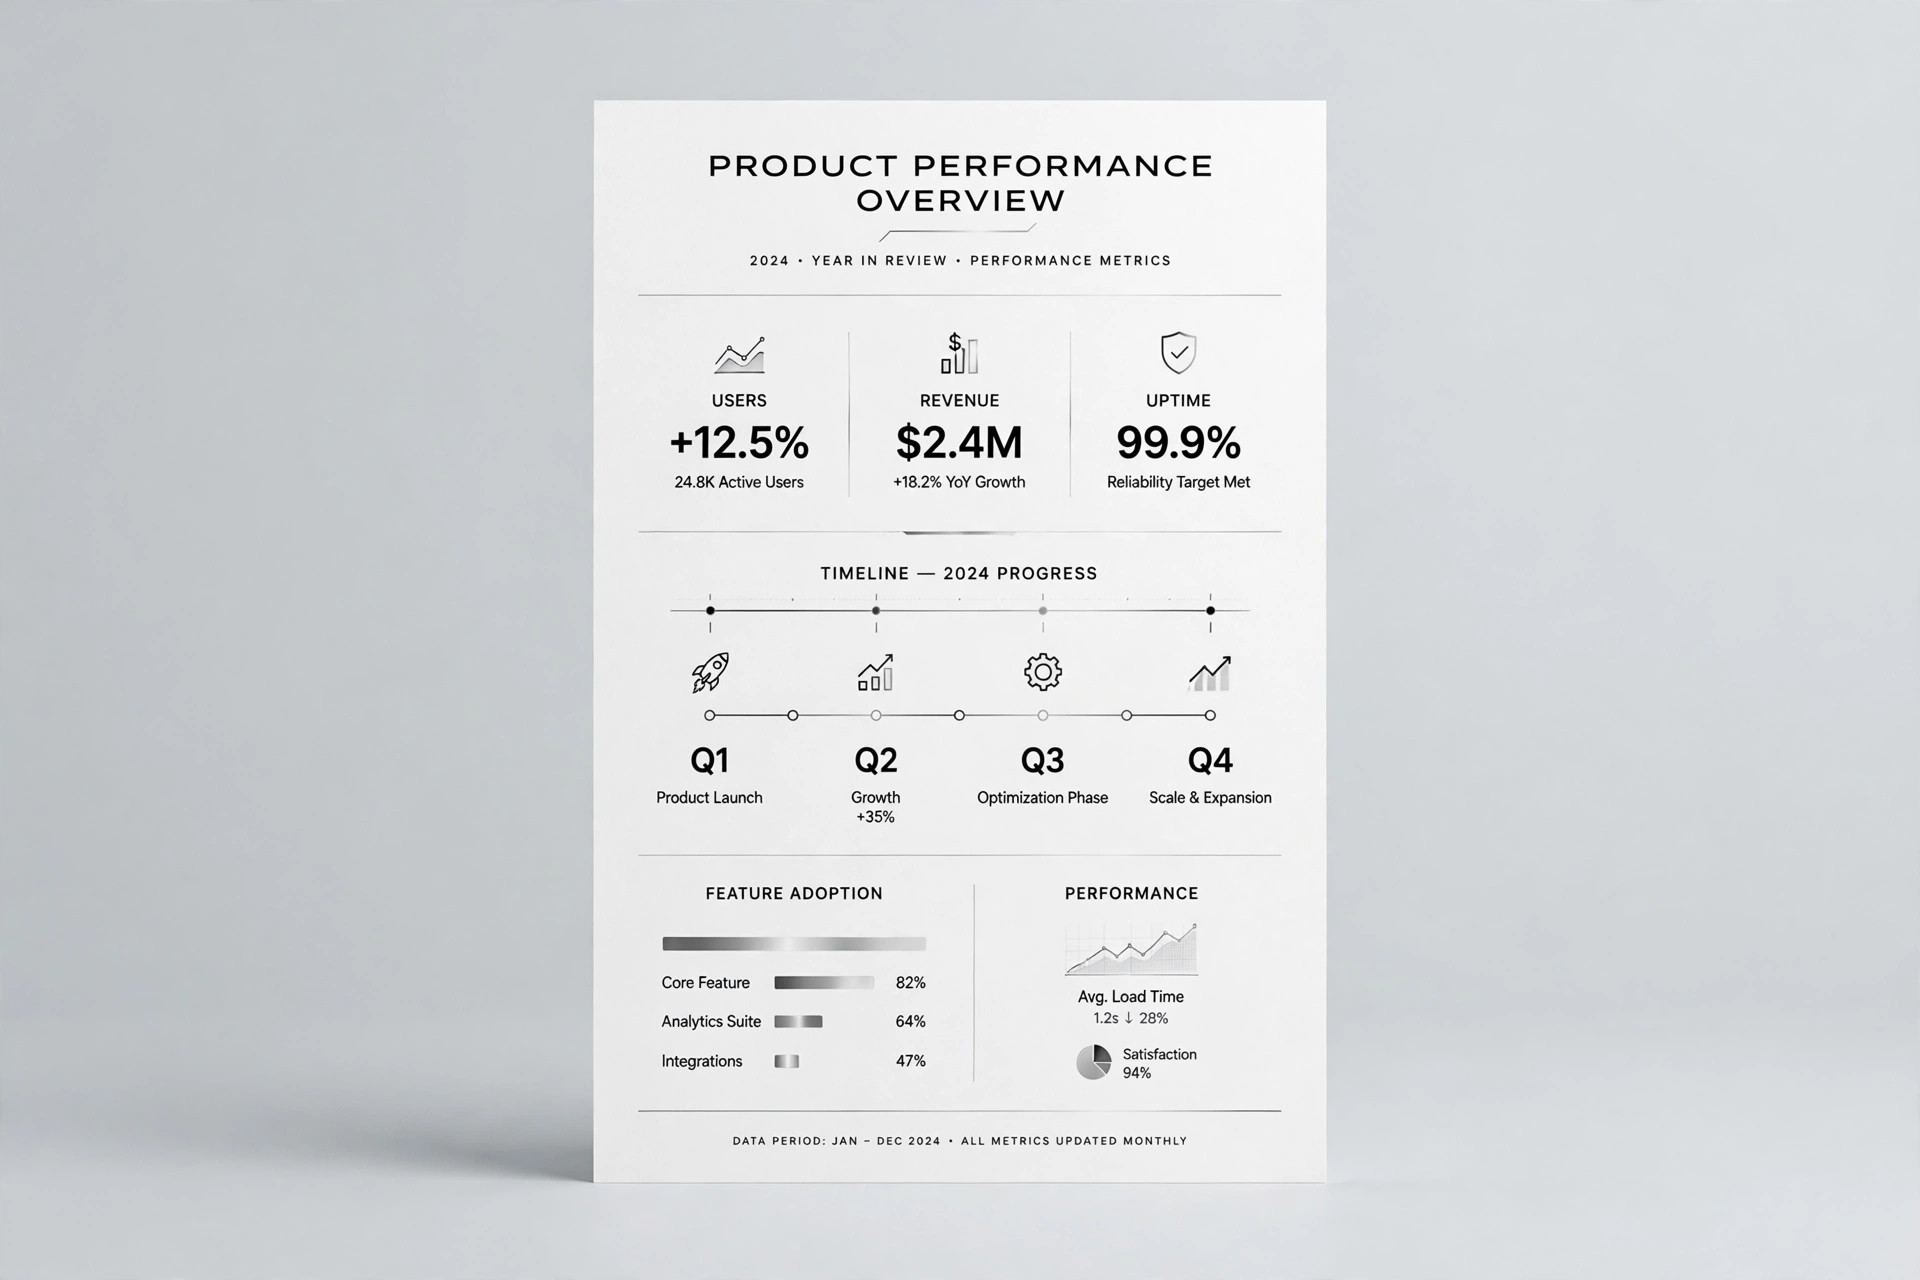
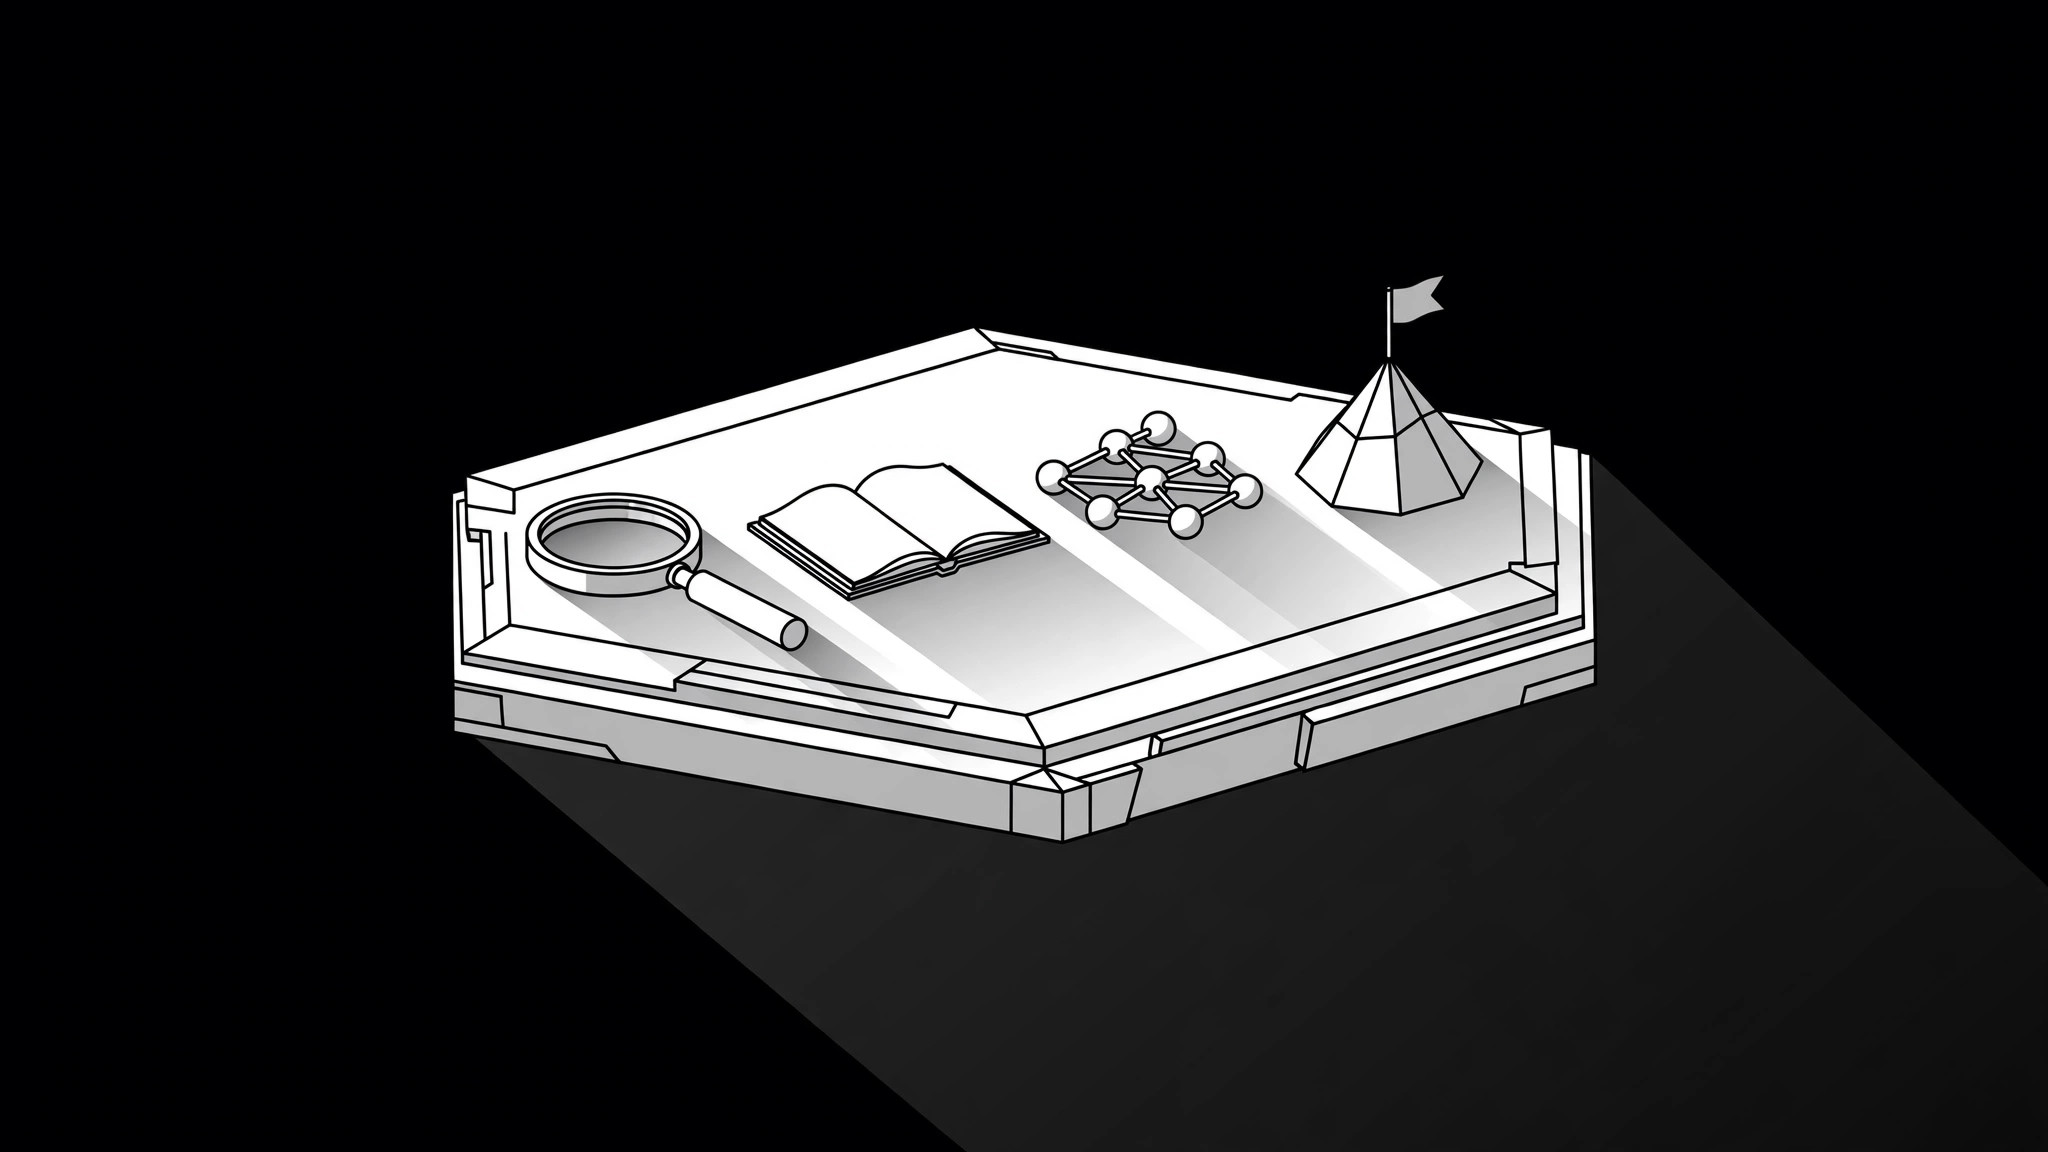
Isometric Research Collage
The whole study in one image — one object per theme.
Turns your AI into an illustration director — arranges the themes of a research project into one isometric collage: a consistent 3D grid, one object per theme, and labels that let a reader walk the findings at a glance.
Install it in 3 steps
No sign-up. No CLI tools. Pick your AI, copy one line, paste it over.
Prefer doing it yourself? Buy the skill ($4.99), download the ZIP from your checkout confirmation, unzip it into the directory shown above, restart your AI session — same result. Already bought it? Your AI assistant can download it for you.
What’s inside
One SKILL.md (the playbook) + one starter template. A preview:
Isometric Research Collage
When to use
- A research report, paper, or white paper needs a cover or summary image that shows several themes at once instead of a single chart
- A presentation opening slide must preview the whole study — methods, findings, implications — before the audience sees any detail
- A blog post or landing page summarizes a multi-part study and needs one image that maps its parts without a wall of text
- A poster or social card announces research with three or more strands and a single icon would flatten it
- A team needs one shared visual that says "here are the pieces of this project and how they sit together"
Workflow
- Extract the themes (input: your report or paper → output: theme list of 3–6 items)
Read the study and pull out its real themes — the questions, methods, or findings the work actually covers, in the study's own terms. Three to six themes is the working range: fewer and you do not need a collage, more and the image becomes a catalogue. For each theme, write one plain sentence of what it covers. If a theme cannot be stated in one sentence, split it or drop it — the collage can only show what you can state clearly. - Assign one object per theme (input: theme list → output: object map)
Give each theme exactly one concrete object or small scene that stands for it — a magnifier for literature review, a survey form for fieldwork, a network of nodes for analysis, a flag on a peak for the headline finding. Objects must be concrete and recognizable at small size; abstract blobs and generic gears say nothing. Check the set together: the objects should look like they belong to one world, not six clip-art drawers. If two themes map to the same object, rethink one of them. - Build the isometric stage (input: object map → output: grid + placement plan)
Set one isometric grid — one angle, one light direction, one ground plane — and place every object on it. Arrange objects so the eye travels in a sensible order: the study's flow (question → method → finding → implication) left to right, or most important theme largest and nearest. Keep generous space between objects; isometric scenes crowd fast. Decide the ground: a single platform, a few stepped levels, or one landscape — and keep it consistent across the whole image.
Template preview
Isometric Research Collage — Build Template
The collage is a table of contents in picture form. Every object must trace back to the study.
Study
Title: {study title} Source document: {report / paper / file} Reading order for the collage: {e.g. question → method → finding → implication}
Themes (3–6, each in one plain sentence from the study)
Object-set check: [ ] all objects look like one world · [ ] no two themes share an object · [ ] no object stands for something the study doesn't cover
Isometric stage
Grid angle: {angle} · Light direction: {e.g. top-left — all shadows fall the same way}