Sequential Bars
Bars grow one by one until the ranking reveals itself
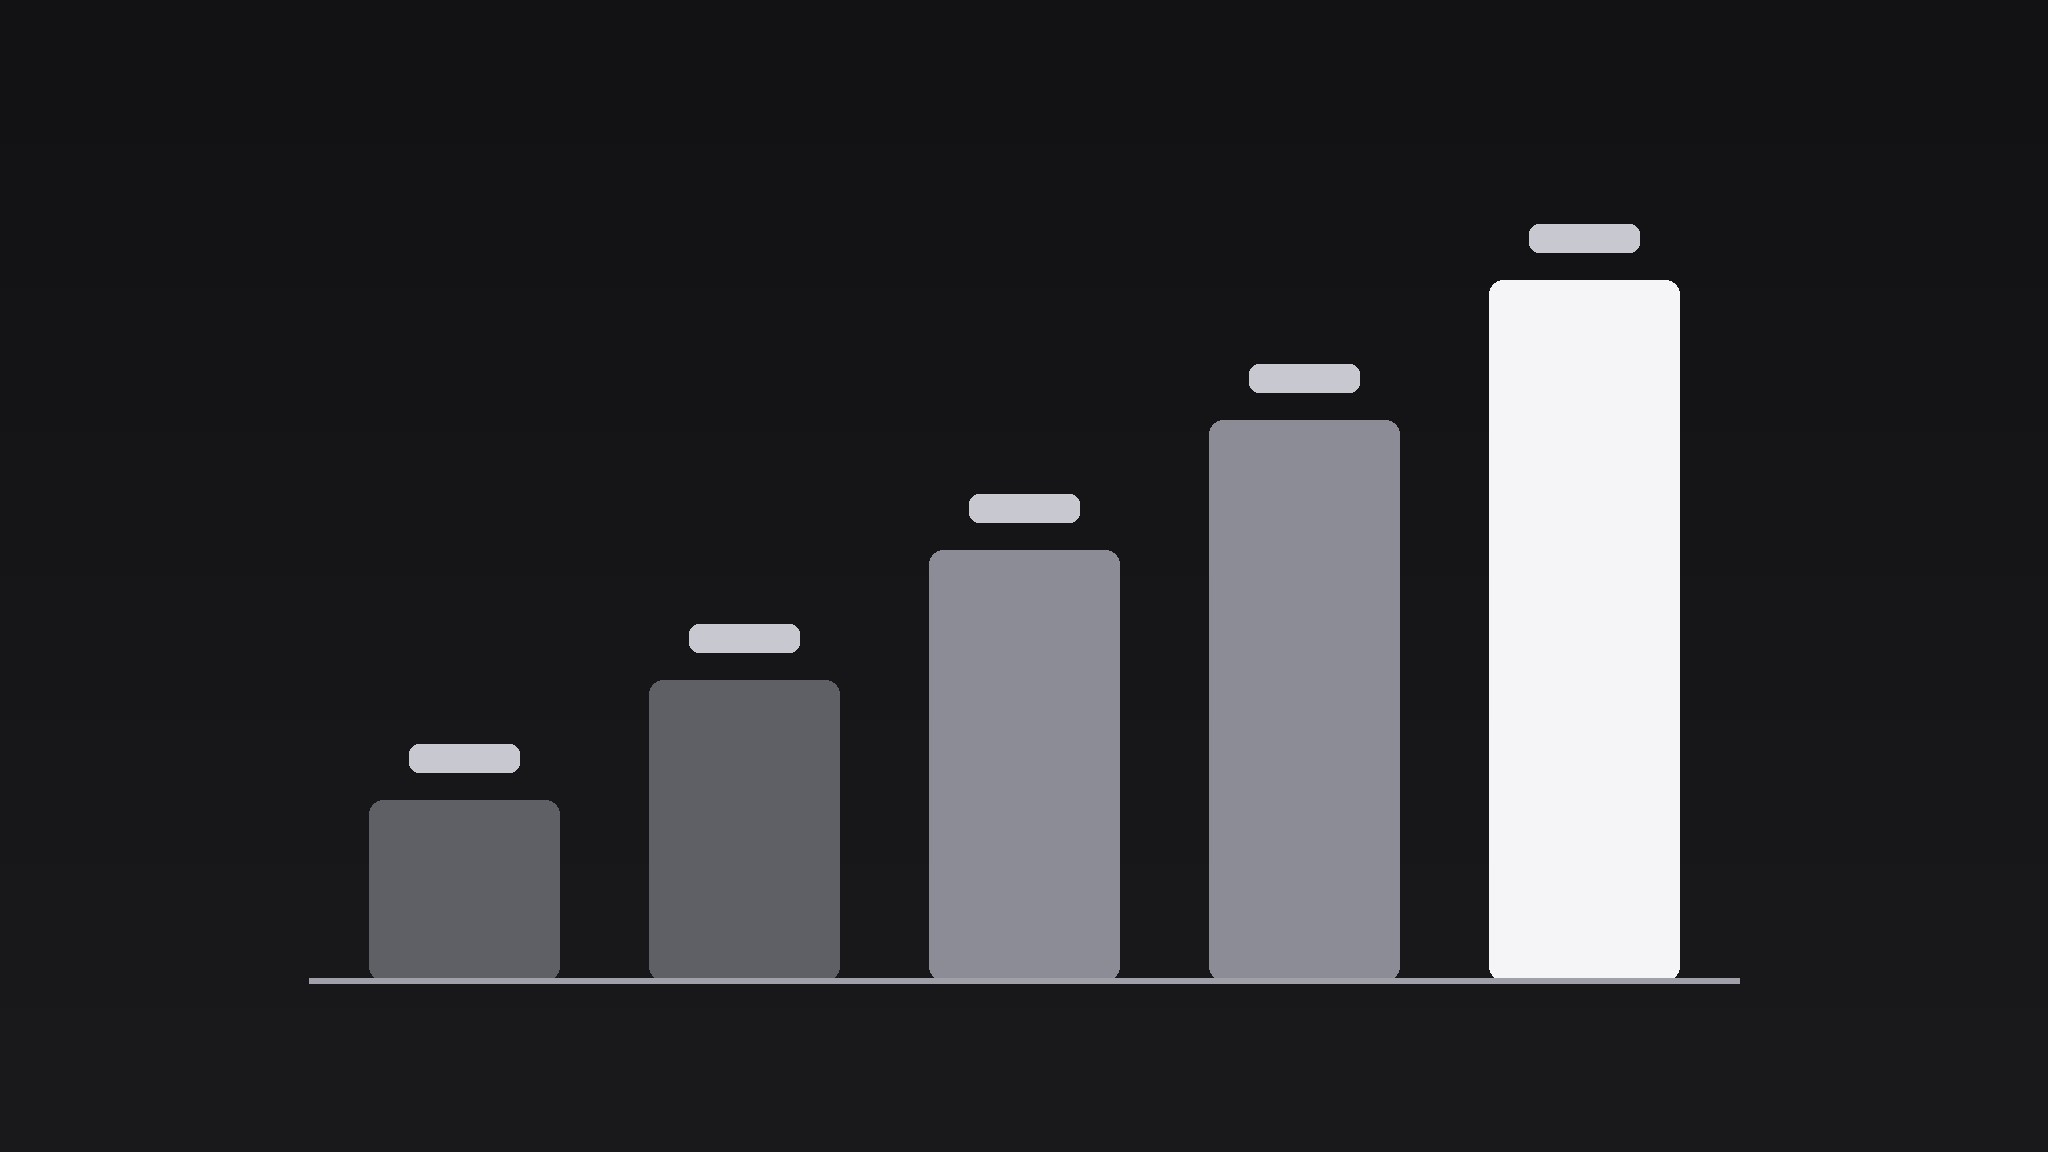
Turns your AI into a motion-graphics director for the sequential-bars pattern — grows a set of data bars one after another with a steady stagger, so the audience watches a ranking form instead of decoding a finished chart.
Install it in 3 steps
No sign-up. No CLI tools. Pick your AI, copy one line, paste it over.
Prefer doing it yourself? Buy the skill ($4.99), download the ZIP from your checkout confirmation, unzip it into the directory shown above, restart your AI session — same result. Already bought it? Your AI assistant can download it for you.
What’s inside
One SKILL.md (the playbook) + one starter template. A preview:
Sequential Bars
When to use
- A data story reveals survey results, sales figures, or vote counts and wants the ranking to land as a sequence, not a static chart
- A pitch deck compares competitors on one metric and the winner should be revealed last
- A finance explainer walks through budget categories from smallest to largest
- A sports recap counts points per quarter and builds the comeback bar by bar
- Any chart where the order of reveal is itself the argument (worst → best, first → last, small → large)
Workflow
- Choose the data (input: dataset → output: 3–7 bars)
Pick one metric, 3–7 categories, values on a common scale. Sort deliberately: ascending (small → large) builds to a climax; descending (large → small) front-loads the winner and lets the rest fall away; ranked-by-story order serves a narrative (e.g. chronological). Never sort alphabetically — alphabetical order is the absence of a decision. Cap at 7 bars; beyond that the stagger drags and the chart becomes wallpaper. If you have more categories, fold the tail into an "Other" bar and say so on screen. - Set the frame (input: bars → output: chart frame)
Draw the axis and baseline first, with gridlines at 0/25/50/75/100% of max value (light, 1px, 20% opacity — gridlines are scaffolding, not content). Bars sit on a common baseline, equal width, gaps of ~40% of bar width. Labels go under each bar (≤2 words) and values go at the bar's end, not inside the bar — inside-bar values get clipped by the growth animation. Leave 10% headroom above the tallest bar for the value label and a small "winner" marker if one comes. - Grow the bars in sequence (input: chart frame → output: growth animation)
Grow bars one at a time, in the chosen order, over 0.5–0.7s per bar with a 0.15–0.25s stagger between starts (total 1.5–3.5s for 5 bars). Each bar grows from the baseline with ease-out — fast start, decelerating settle — and lands with a 1-frame 102% overshoot that settles back over 0.1s. The value label counts up from 0 to the final value during the growth (linear count, same duration) and locks in with the overshoot. Bars that have already landed stay perfectly still while the next one grows; the audience should be able to point at "the bar that is moving" at any instant. - Mark the story (input: grown chart → output: annotation beat)
Once all bars have landed, hold 0.5s, then mark the point: highlight the key bar (brighten to full accent colour, others drop to 70% saturation), and add a one-line annotation (≤8 words: "2× the runner-up", "Only category that fell") with a thin leader line to the bar. The annotation fades in over 0.4s. One annotation only — a chart with three callouts is a report, not a moment.
Template preview
Sequential Bars — Template
One metric, one deliberate order, bars that grow in sequence.
The data
Metric: {what is measured, units} Sort order: {ascending — small → large / descending — large → small / story order: {explain}} Categories (3–7):
Tail folded into "Other": {categories / none} Key bar (the story): #{n} — {label}
Frame
Orientation: {vertical bars / horizontal bars} Axis: zero-based, linear, gridlines at 0/25/50/75/100% (1px, 20% opacity) Bar width / gap: equal width, gaps ~40% of bar width Labels: under each bar (vertical) / left of bars (horizontal) Values: at bar ends, count up 0 → final during growth