Records and Donut
Vinyl discs meet a donut chart — the collection you can read.
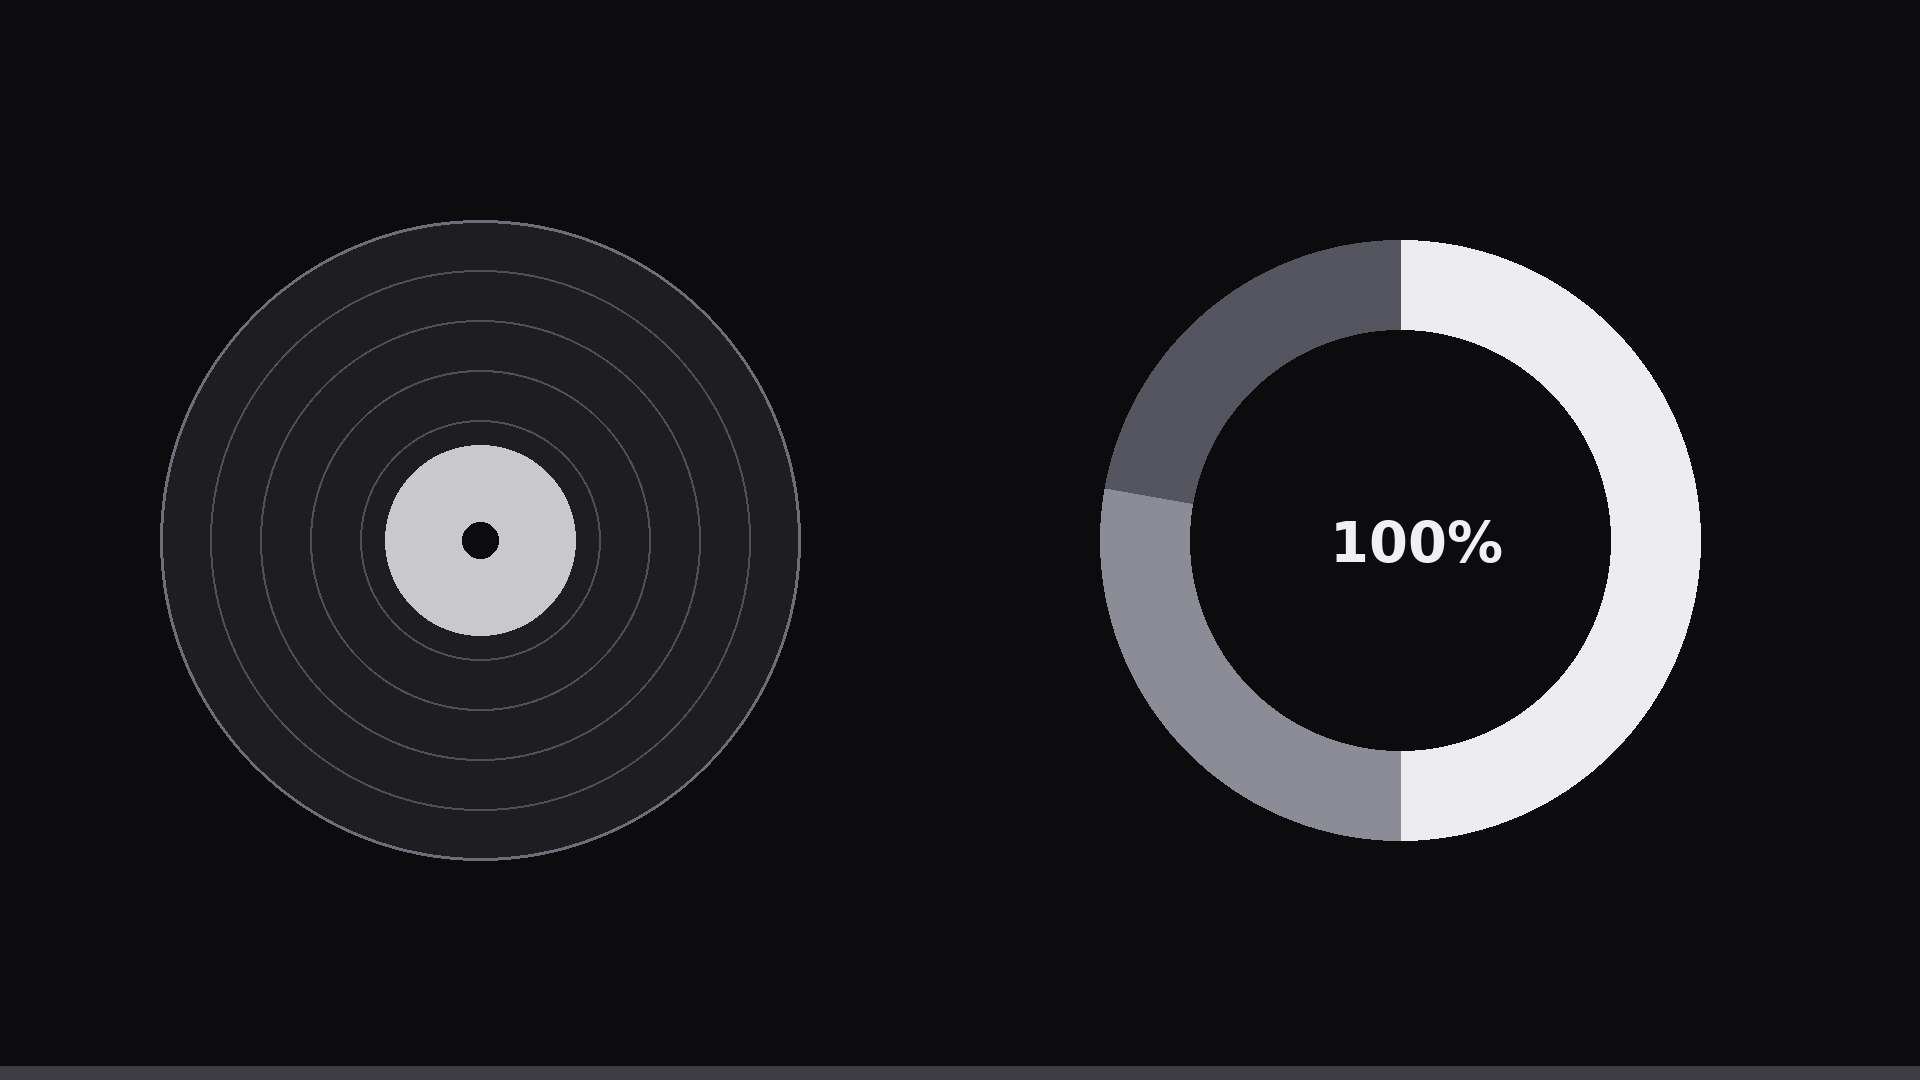
Spinning record discs paired with a donut chart: each record is a category, the donut shows its share, and matching colors link disc to segment.
Install it in 3 steps
No sign-up. No CLI tools. Pick your AI, copy one line, paste it over.
Prefer doing it yourself? Buy the skill ($4.99), download the ZIP from your checkout confirmation, unzip it into the directory shown above, restart your AI session — same result. Already bought it? Your AI assistant can download it for you.
What’s inside
One SKILL.md (the playbook) + one starter template. A preview:
Records and Donut
When to use
- You are showing a share-of-whole breakdown (3–6 categories) where a plain donut feels generic and the subject has a music, audio, or collection flavor
- The categories map naturally to discs: genres, artists, labels, formats, decades, playlists
- You want a 15–30 second clip for a music recap, a label report, a store's year-in-review, or a collection tour
- The audience should feel the collection as physical objects (records) AND read the exact shares (donut) — neither visual alone does both jobs
- A static donut in a slide deck needs a motion version for video without losing the numbers
Workflow
- Pick the categories (input: breakdown → output: 3–6 records + shares)
Choose 3–6 categories with shares summing to ~100%. Each category gets: a 1–3 word label, its percentage, and a record identity — a color for the disc label, and optionally a two-letter code or tiny icon at the disc center. Sort by share descending; the biggest record is the visual anchor. Merge slivers below ~4% into "Other" (one grey record) so the set stays readable. - Stage the two visuals (input: categories → output: composition)
Composition: the donut on one side (right half for horizontal, bottom half for vertical), the records on the other — a row, an arc, or a loose stack, one disc per category, sized by share (largest disc ~1.6× the smallest). Every record's label color matches its donut segment exactly — color is the key that links the two visuals. Donut: thick ring (28–34% of radius), center hole holding the total ("100%" or the grand total like "1,240 plays"), segment labels outside with leader lines or just values on the ring. - Spin the records (input: composition → output: spin keyframes)
Records rotate slowly and continuously: one full rotation per 12–20 s, linear easing, all discs the same direction. Slow is the point — a fast spin looks frantic and makes labels unreadable. Each disc keeps its label upright: counter-rotate the label layer so text stays readable while the grooves spin beneath it (or place the label on a static center hub). Grooves: 3–5 concentric hairlines per disc, plus a soft highlight arc that stays fixed while the disc turns — the highlight sells the rotation. - Grow the donut (input: composition → output: donut keyframes)
Donut segments draw in one at a time, clockwise from 12 o'clock, in descending-share order: each segment sweeps from 0 to its angle over 0.5–0.7 s (ease-out), with its label fading in as it lands (0.3 s). As each segment completes, its matching record does a single emphasis pulse — scale 1.0 → 1.06 → 1.0 over 0.4 s — so the eye links disc to segment. Stagger segments by 0.15 s; total donut build under 3.5 s.
Template preview
Records and Donut — Template
Fill in the blanks, then build the clip from the SKILL.md workflow.
Data
Whole (what 100% means): {e.g. total plays / shelf records / catalog tracks} Grand total (goes in donut hole): {e.g. 1,240 plays}
Total: {100}% | Source: {source, date}
Composition
Format: [ ] Horizontal 1920×1080 (donut right, records left) / [ ] Vertical (donut bottom, records top) Record arrangement: [ ] Row / [ ] Arc / [ ] Loose stack Disc size ratio: largest ~1.6× smallest Donut ring thickness: 28–34% of radius | Center hole: {grand total}
Animation
Record spin: one rotation per {12–20 s}, linear, all discs same direction