Ratio Bars
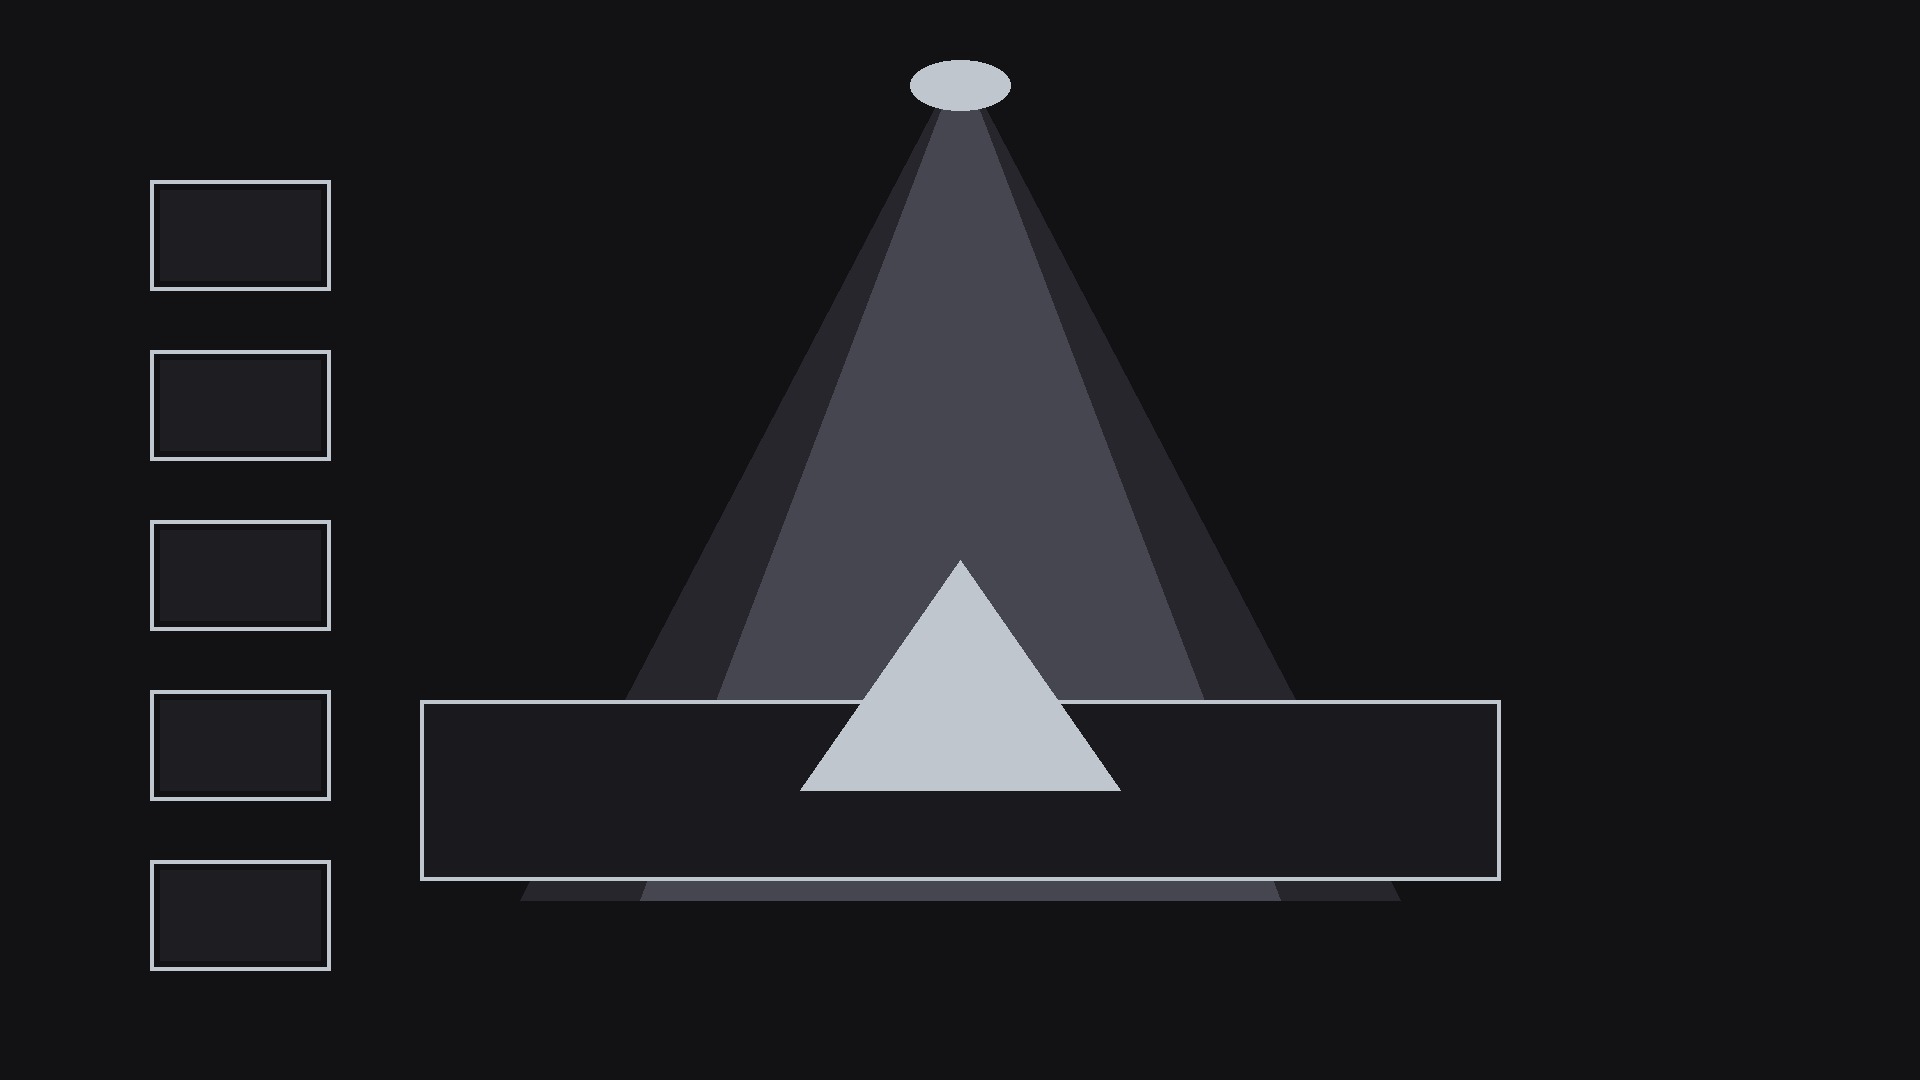
Proportional bars that grow to their values — ranking visible at a glance.
Proportions as animated horizontal bars: each bar grows from zero to its value with its percentage counting up beside it, so ranking and gaps are visible at a glance.
Install it in 3 steps
No sign-up. No CLI tools. Pick your AI, copy one line, paste it over.
Prefer doing it yourself? Buy the skill ($4.99), download the ZIP from your checkout confirmation, unzip it into the directory shown above, restart your AI session — same result. Already bought it? Your AI assistant can download it for you.
What’s inside
One SKILL.md (the playbook) + one starter template. A preview:
Ratio Bars
When to use
- You have 3–7 parts of a whole (percentages that sum to ~100%) and want the audience to feel the sizes, not just read numbers
- A pie chart is too cramped to label, or the differences between slices are too small to see as angles
- The ranking matters: the viewer should instantly see what is biggest, what is tiny, and the gaps between them
- You are presenting survey results, a budget split, time allocation, or market share in a 15–30 second clip or a single animated slide
- The numbers will be compared across two moments (before/after, this year/last year) — bars make change readable
Workflow
- Clean the numbers (input: raw figures → output: 3–7 labeled values summing to ~100%)
Convert everything to percentages of the same whole. Sort descending — biggest bar on top — unless the categories have a natural order (e.g. age bands, price tiers) that the audience already knows; then keep that order and say so. Merge slivers below ~3% into "Other" so the chart isn't a row of unreadable threads. Round to whole percents; if rounding breaks the total, adjust the largest value by the remainder and note it. Each bar gets a 1–4 word label. - Lay out the bars (input: values → output: static bar layout)
One row per category: label left (or above the bar), bar in the middle, value right. Bars share one baseline at zero and one maximum scale — never rescale individual bars, or the visual lies. Bar height: 36–56 px at 1080p, gap between rows 18–28 px. Value labels in the same weight as the labels, aligned right so the numbers form a clean column. Background: quiet; gridlines at 0/25/50/75/100% in faint strokes if they help reading, omitted if they clutter. - Animate the growth (input: static layout → output: bar keyframes)
All bars grow left-to-right from zero simultaneously over 1.2–1.8 s, ease-out (fast start, settling end). Simultaneous growth lets the eye compare final lengths; staggered growth makes the viewer wait and invites a false "race" reading. If you do stagger (e.g. to narrate each bar), stagger by 0.2 s and keep the total under 3 s. The value numbers count up in sync with the bar length (0 → final value over the same duration), formatted as whole percents. - Emphasize the takeaway (input: grown bars → output: emphasis pass)
Once growth completes, emphasize the one bar the story is about: it keeps full color while the others dim to 35–45% opacity, or a thin highlight outline draws around it (0.4 s, ease-out). Add a one-line takeaway beneath the chart ("Over half goes to X") — 8–12 words, appearing 0.3 s after the emphasis. If there is no single takeaway, skip the emphasis: dimming without a point just looks like a mistake.
Template preview
Ratio Bars — Template
Fill in the blanks, then build the chart from the SKILL.md workflow.
Data
Whole (what 100% means): {e.g. survey respondents / monthly budget / market} Order: [ ] Descending / [ ] Natural order ({state the order}) Rounding note: {e.g. largest value adjusted by 1 pt so total = 100%}
Total: {100}% | Source / footnote: {source, date}
Layout
Format: [ ] Horizontal 1920×1080 / [ ] Square 1080×1080 Bar height: {36–56 px} | Row gap: {18–28 px} Gridlines: [ ] 0/25/50/75/100% faint / [ ] None Palette: {one hue family + one accent for takeaway bar}