Portfolio Tracker
Your holdings, watched on autopilot, reported on a schedule.
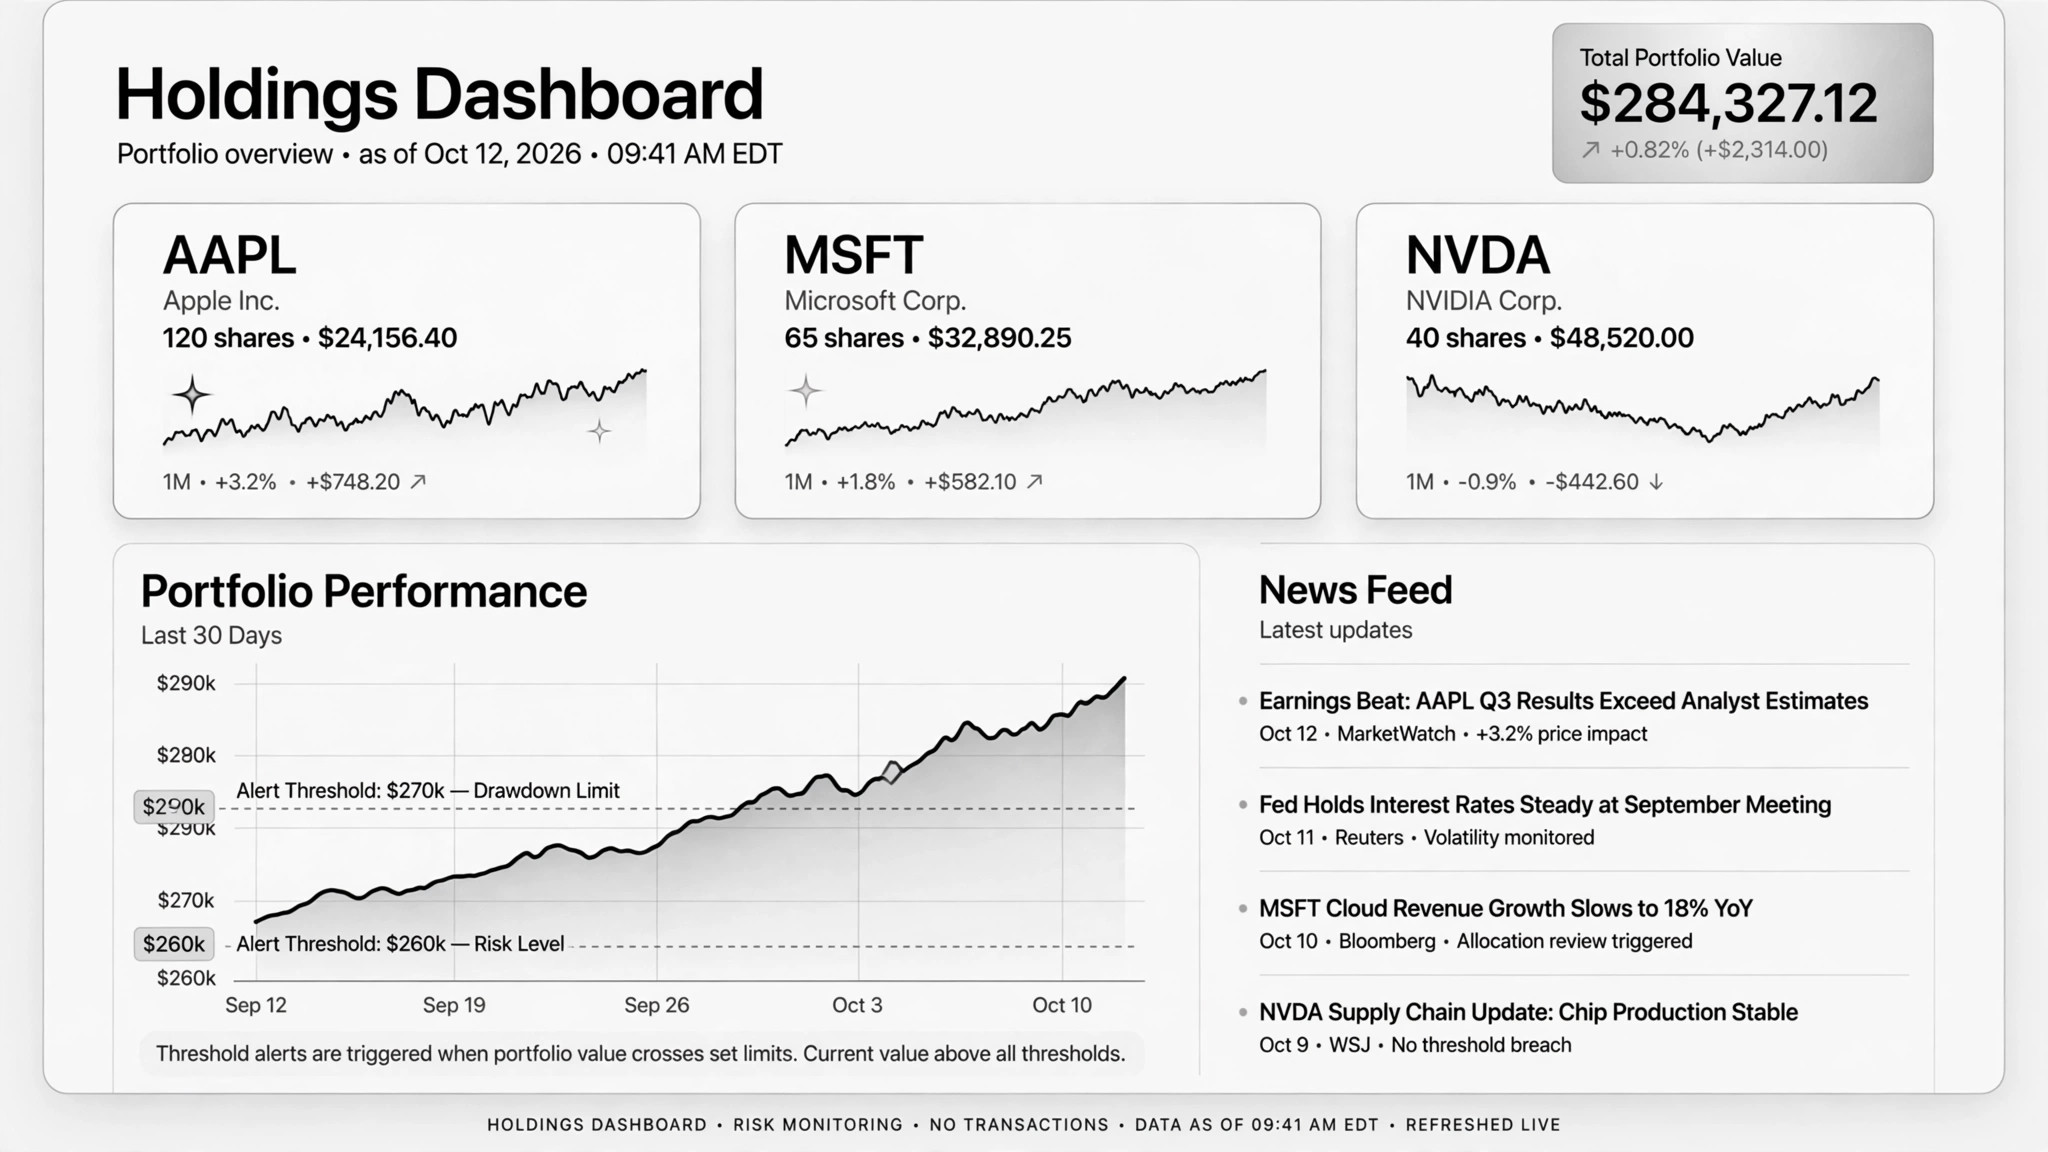
Helps AI watch your investments on autopilot — logging holdings and watchlist changes over time, writing periodic research reports with bull/bear cases, and alerting when your own thresholds break. For long-term holders who want analysis without the day-trading noise.
Install it in 3 steps
No sign-up. No CLI tools. Pick your AI, copy one line, paste it over.
Prefer doing it yourself? Buy the skill ($4.99), download the ZIP from your checkout confirmation, unzip it into the directory shown above, restart your AI session — same result. Already bought it? Your AI assistant can download it for you.
Real-world proof
Real people did this exact job with AI agents.
Research stock positions as an AI analyst
Read case →Use caseTrack investments over time via Claude Code and Robinhood MCP
Read case →What’s inside
One SKILL.md (the playbook) + one starter template. A preview:
Portfolio Tracker
When to use
- You hold a dozen stocks and can't keep up with the news on all of them every week
- You keep a watchlist of companies you might buy and want to hear about them only when something matters
- You want a regular, structured look at your portfolio — performance, news, and risk — without paying for a research subscription
- You've set yourself risk limits but never actually check whether they've been breached
- You keep a running investment journal and want it updated from real data, not memory
Workflow
- Connect in read-only (input: brokerage account or data feed → output: confirmed read-only connection)
Hook up the data source — an official broker MCP or API — and verify the permission is read-only before anything else. The connection must be able to see holdings but unable to trade. This is a hard gate: no read-only, no tracker. - Define what you hold and what you watch (input: positions + watchlist → output: tracking sheet)
List current holdings (ticker, position size, entry date, entry price) and the watchlist with why each name is on it. Snapshot everything into a log file the first run — that baseline is what every future comparison runs against. - Set your risk lines (input: your risk tolerance → output: alert thresholds)
Write the lines you care about: "alert me if any position drops 15% from entry," "flag if a holding falls below its 200-day average," "tell me about insider selling over $1M." These are yours to set, not the AI's — it enforces them, it doesn't choose them. - Run the research pass on schedule (input: tracking sheet + fresh news/prices → output: research report)
On a cadence you pick (weekly or twice-weekly works), the AI pulls fresh prices and news for holdings and watchlist, then writes a report: per-name news summary, the bull case and bear case in plain words, scenario notes, and which thresholds broke. One real case runs this twice a week across 15 tickers. - Log everything, decide yourself (input: research report → output: updated investment journal)
Every run appends to the journal: date, prices, what changed, what was flagged. You read the report and make every buy and sell decision yourself. The tracker never recommends a trade — it shows you what happened and what's near your lines.
Output spec
Template preview
Portfolio Tracker — Tracking Sheet Template
One sheet. Baseline first, then every report runs against it.
Connection
- Data source: {broker MCP / API}
- Permissions: READ-ONLY (verified {date} — trading functions off)
- Report cadence: {e.g. every Tuesday and Friday, 8am}
Holdings baseline
Watchlist
Alert thresholds
- [ ] Any holding down {x}% from entry
- [ ] Any holding below its {200-day} moving average
- [ ] Insider selling > ${x} reported this week
- [ ] Watchlist name crosses my watch price
- [ ] {your own line}
Alert rule: only when MY lines break — no market noise, no "hot stock" tips.