Metric to Interface Detail
Dive from the headline number into the screen behind it.
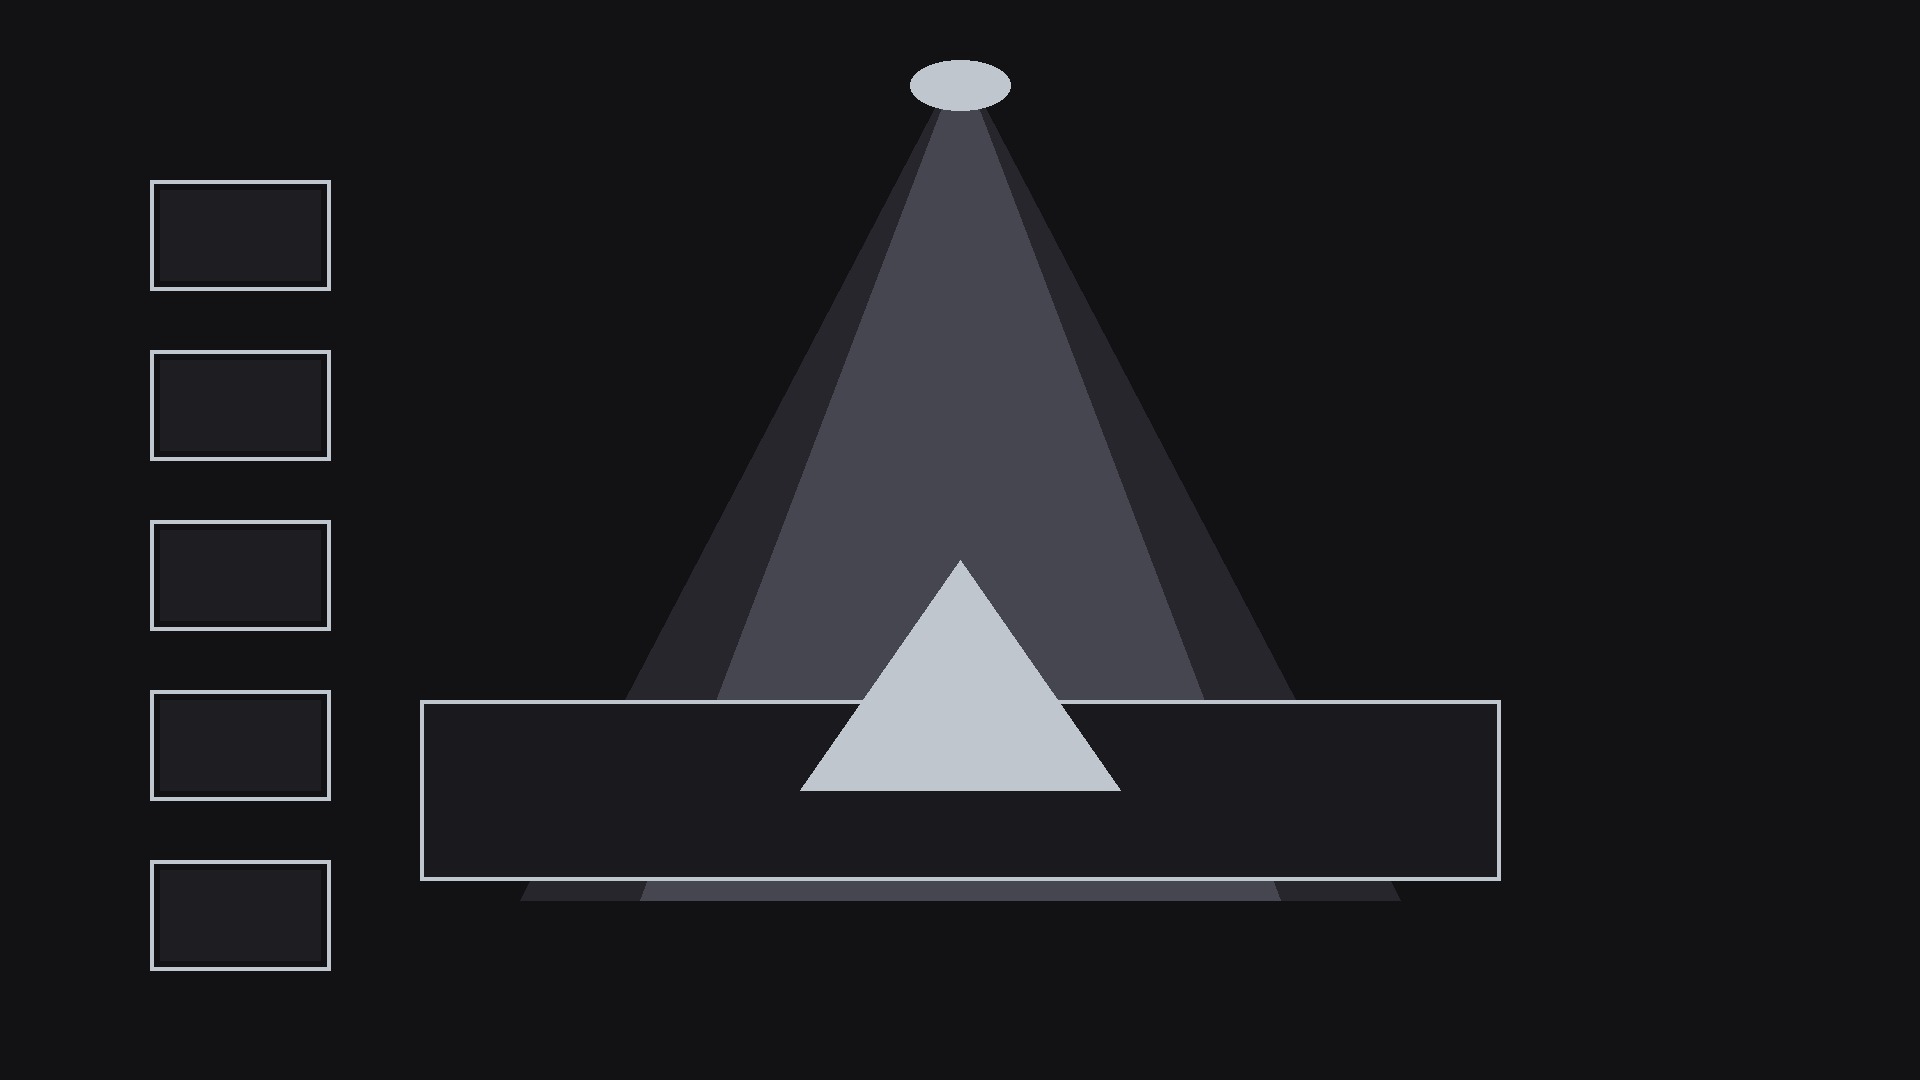
Turns your AI into a motion designer for one specific pattern — a big headline metric zooms in and resolves into the exact interface detail that produced it, so the viewer sees the number and its source in one continuous move. For product demos, analytics explainers, and KPI videos where a number alone invites doubt.
Install it in 3 steps
No sign-up. No CLI tools. Pick your AI, copy one line, paste it over.
Prefer doing it yourself? Buy the skill ($4.99), download the ZIP from your checkout confirmation, unzip it into the directory shown above, restart your AI session — same result. Already bought it? Your AI assistant can download it for you.
What’s inside
One SKILL.md (the playbook) + one starter template. A preview:
Metric to Interface Detail
When to use
- A product demo quotes a headline metric ("−32% churn") and the viewer immediately wonders where that number came from — the zoom answers before the doubt forms
- An analytics explainer needs to connect an abstract KPI to a concrete screen: the number is the door, the interface detail is the room behind it
- A dashboard tour introduces each metric by showing it first, then diving into the chart, row, or setting that generated it
- A case-study video presents a result, then proves it by landing on the report, filter, or record the result was read from
- A pitch or review video wants to move from "what" to "how" without a hard cut — the continuous zoom keeps the thread unbroken
- A tutorial teaches a metric's definition by showing the exact UI elements that feed into it, one zoom at a time
Workflow
- Pick the metric and its source detail (input: your claim + your product → output: metric-detail pair)
Write the metric as it will appear ("−32% churn, 90 days") and name the single interface detail that is its most direct source — one chart segment, one table row, one toggle, one filter setting. One metric, one detail: if two screens contributed, pick the one that would convince a sceptic and mention the other in voiceover. The detail must be a real, capturable screen element, not a diagram invented for the video. If you can't point at the screen that produced the number, the zoom has nothing to land on — pick a different metric. - Frame the metric as a doorway (input: metric-detail pair → output: opening frame)
Open on the metric huge and centred, with the source screen faintly visible behind it at low opacity (10–15%) or blurred — enough to hint that a real interface is behind the number, not enough to read. Hold 900ms–1.2s. The metric's typography should match the product's own number style where possible (same weight, same tabular figures), so the zoom feels like entering the product rather than leaving the video for it. Keep any supporting text to one short line under the number.
Template preview
Metric to Interface Detail — Starter Template
One metric, one source detail, one continuous zoom. Fill in the pair before animating.
The pair
Metric (as it appears on screen): {e.g. −32% churn, 90 days}
Source detail (the single screen element that produced it): {e.g. Cancelled-accounts chart, 90-day filter row}
Definition check: {Does the landed detail produce this number by the definition the video states? Yes — explain in one line}
Opening frame
- Metric typography: {match product's number style — weight, tabular figures}
- Background screen: {which screen, blurred / 10–15% opacity}
- Supporting line (≤1, optional): {e.g. vs previous quarter}