Line and Trend Draw
The line draws itself, and the trend tells the story.
Turns your AI into a motion designer for draw-on line charts — the line draws itself across the frame in sync with narration, so the trend is visible before any number appears. For data explainers, business updates, and presentations where the shape of the story matters more than the spreadsheet.
Install it in 3 steps
No sign-up. No CLI tools. Pick your AI, copy one line, paste it over.
Prefer doing it yourself? Buy the skill ($4.99), download the ZIP from your checkout confirmation, unzip it into the directory shown above, restart your AI session — same result. Already bought it? Your AI assistant can download it for you.
What’s inside
One SKILL.md (the playbook) + one starter template. A preview:
Line and Trend Draw
When to use
- A data explainer where the audience needs to feel the trend (rising, flat, collapsing) before hearing any numbers
- A business update or earnings recap where one line — revenue, users, costs — carries the quarter's story
- A presentation slide that would otherwise be a static chart the speaker reads aloud while the audience reads ahead
- A news or policy segment where a single series over time is the evidence for the argument
- A tutorial that teaches chart reading by showing the line being built, not by showing the finished chart
- A social clip where a chart screenshot would get skipped, but a line drawing itself in two seconds gets watched
Workflow
- Pick one line (input: your data → output: the single series)
One chart, one line. If the story needs two lines, it needs two charts in sequence — two lines drawing at once split the eye and neither trend registers. Choose the series that carries the claim (revenue, not revenue-plus-costs-minus-churn), and define its range honestly: the y-axis starts at zero unless you explicitly label a truncated axis, and the time range covers exactly the period the narration discusses. Cut the data to the story's window — a 10-year series for a story about the last 18 months buries the relevant movement in flat history. - Set the axes before the line (input: the single series → output: chart frame)
Draw the axes and gridlines first, static, before any line appears. The audience needs the frame's scale to judge the line's movement — a line that rises means nothing if the viewer does not know whether the axis runs 0–100 or 0–10,000. Label the y-axis with 3–5 ticks (round numbers only), label the x-axis with the time range, and keep gridlines faint — visible enough to read against, quiet enough that the line owns the frame. The axes appear with a simple 200ms fade, not a build; the line is the star, the frame is the stage. - Draw the line in sync with narration (input: chart frame + narration → output: draw-on keyframes)
The line draws itself left to right using a stroke-dashoffset (or trim-path) animation: the path is fully drawn in the file, then revealed progressively, so the line appears to be drawn by an invisible pen. Pace the draw to the narration — the line should reach each turning point at the moment the voice mentions it. Total draw time: 2–4 seconds for a simple line, up to 6 seconds for a long series with several turns. Use linear easing for the draw itself: ease-in-out on a draw makes the pen appear to speed up and slow down for no reason, and the audience reads that as the data hesitating. The pen tip may carry a small dot at the leading edge — a 6–8px dot in the line's colour — so the eye always knows where the drawing is.
Template preview
Line and Trend Draw — Starter Template
One chart, one line. The trend must be visible before any number appears.
Chart: {title} | Series: {metric} | Period: {start} → {end}
Claim this line supports (one sentence): "{The shape shows...}"
Data (the story's window only)
Y-axis: starts at [ ] zero [ ] truncated at {value} — truncation labelled on axis: [ ] Y-ticks (3–5, round numbers): {0, ..., ..., ...} X-axis labels: {time range}
Annotations (max 3)
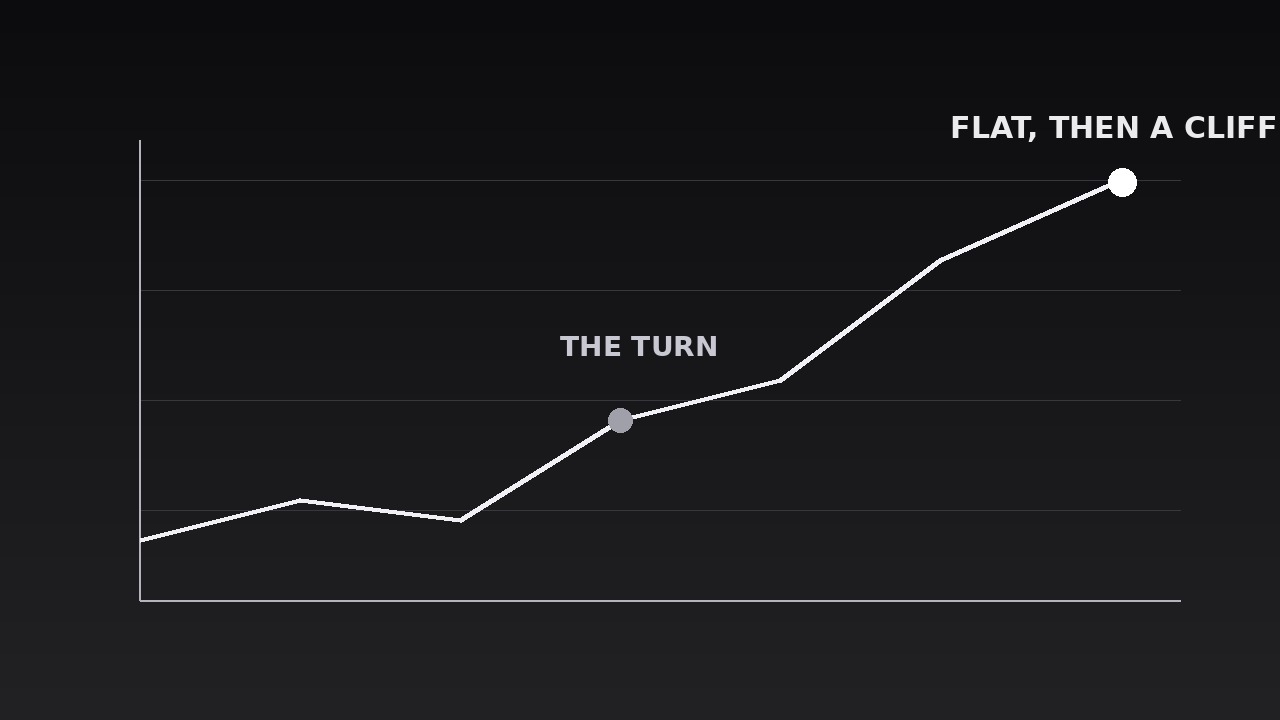
Trend callout (≤6 words, describes the shape, not the numbers)
> "{Flat, then a cliff. / Steady climb. / Rise, peak, collapse. / ...}"