Chart Viewport Scan
Glide across a chart too big to show at once.
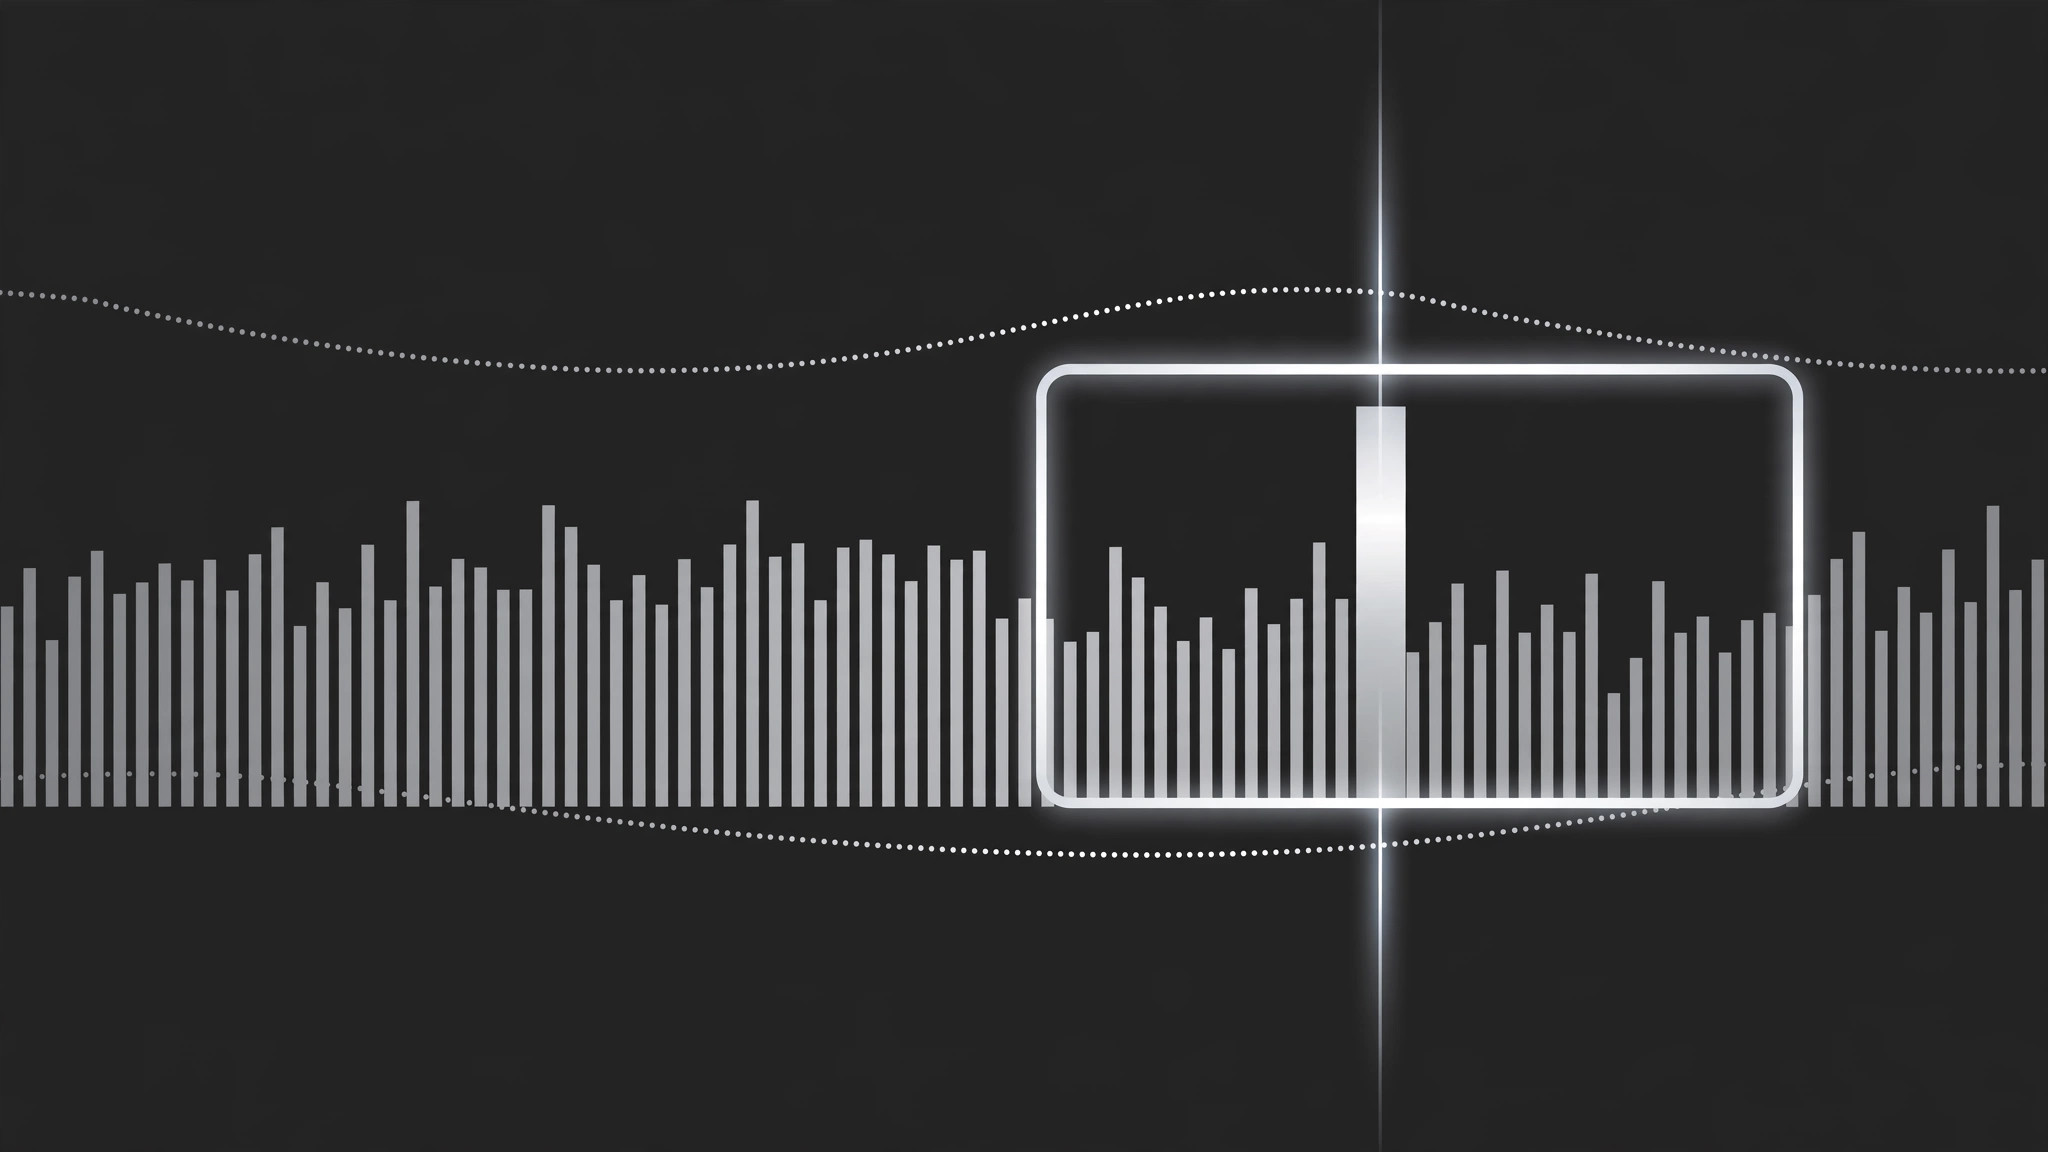
A camera-like viewport that pans and zooms across a dense chart in story order, pausing at each key region while a scan line marks exactly where the eye should be. Ends on the full chart or the one takeaway number.
Install it in 3 steps
No sign-up. No CLI tools. Pick your AI, copy one line, paste it over.
Prefer doing it yourself? Buy the skill ($4.99), download the ZIP from your checkout confirmation, unzip it into the directory shown above, restart your AI session — same result. Already bought it? Your AI assistant can download it for you.
What’s inside
One SKILL.md (the playbook) + one starter template. A preview:
Chart Viewport Scan
When to use
- A chart is too wide or too dense to read at full-frame scale (a 12-month timeline, a 40-bar ranking, a scatter with a crowded corner)
- You want to walk the viewer through a chart left-to-right or along its story, instead of dumping the whole thing on screen at once
- A dashboard has one region that matters and the rest is context — the scan travels from context to focus
- A before/after comparison lives at opposite ends of one long chart
- A chart reveal needs motion with a purpose: the camera moves because the data has a direction, not because the frame looked static
Workflow
- Map the scan path (input: chart → output: ordered list of 2–5 waypoints)
Mark the waypoints the viewport will visit, in the order the story needs: usually left-to-right along the x-axis, or context → focus. Each waypoint = one readable region (a cluster of bars, one axis segment, one outlier) with a one-line narration note. Keep it to 2–5 waypoints; a scan with eight stops is a slideshow wearing a camera costume. The first waypoint should include enough of the chart's axes and labels that the viewer can orient before the camera starts moving. - Set the viewport size (input: waypoints → output: zoom level per waypoint)
At each waypoint, the viewport frames exactly that region with a 10–15% margin — tight enough to read the smallest label, loose enough that bars are not clipped mid-bar. All waypoints share one zoom philosophy: if the first waypoint is at 150% zoom, the rest should be within ±25% of it unless a waypoint is deliberately a pull-back for context. Zoom whiplash (180% → 90% → 200%) makes viewers seasick; a scan should feel like leaning in, not teleporting. - Animate the travel (input: waypoints → output: pan/zoom keyframes)
Travel between waypoints takes 1.2–2.0 s, with ease-in-out on both pan and zoom so the camera accelerates out of a stop and decelerates into the next. Pan and zoom happen together in a single move — never zoom first then pan, or the path kinks. Between waypoints, the camera never stops mid-path; every pause happens at a waypoint, where it holds still for the narration (1.5–3 s per stop, matched to the spoken line). - Add the scan line (input: viewport path → output: scan-line overlay)
A thin vertical or horizontal line (2 px, high-contrast) travels with the viewport's leading edge and marks the current reading position on the chart. It is a pointer, not a decoration: it sits exactly where the narration is. When the camera holds at a waypoint, the scan line holds too, parked on the specific bar, point, or threshold being discussed. If the narration names a value ("this bar, 42%"), the scan line touches that bar while the words land.
Template preview
Chart Viewport Scan — Production Template
One chart, one continuous scan. Plan the path before animating a single keyframe.
Chart: {chart title / file} — Source resolution: {≥2× delivery}
Full chart shows: {what the whole chart says in one line}
Scan path (2–5 waypoints, story order)
Legend: [ ] Inside waypoint 1 frame [ ] Corner overlay for whole scan
Camera
- Travel between waypoints: {1.2–2.0 s}, ease-in-out, pan + zoom in one move
- Viewport margin at each stop: {10–15%} — no bar clipped mid-bar
- No mid-path pauses: [ ] Confirmed
Scan line
- Thickness: {2 px} | Color: {high-contrast vs chart}