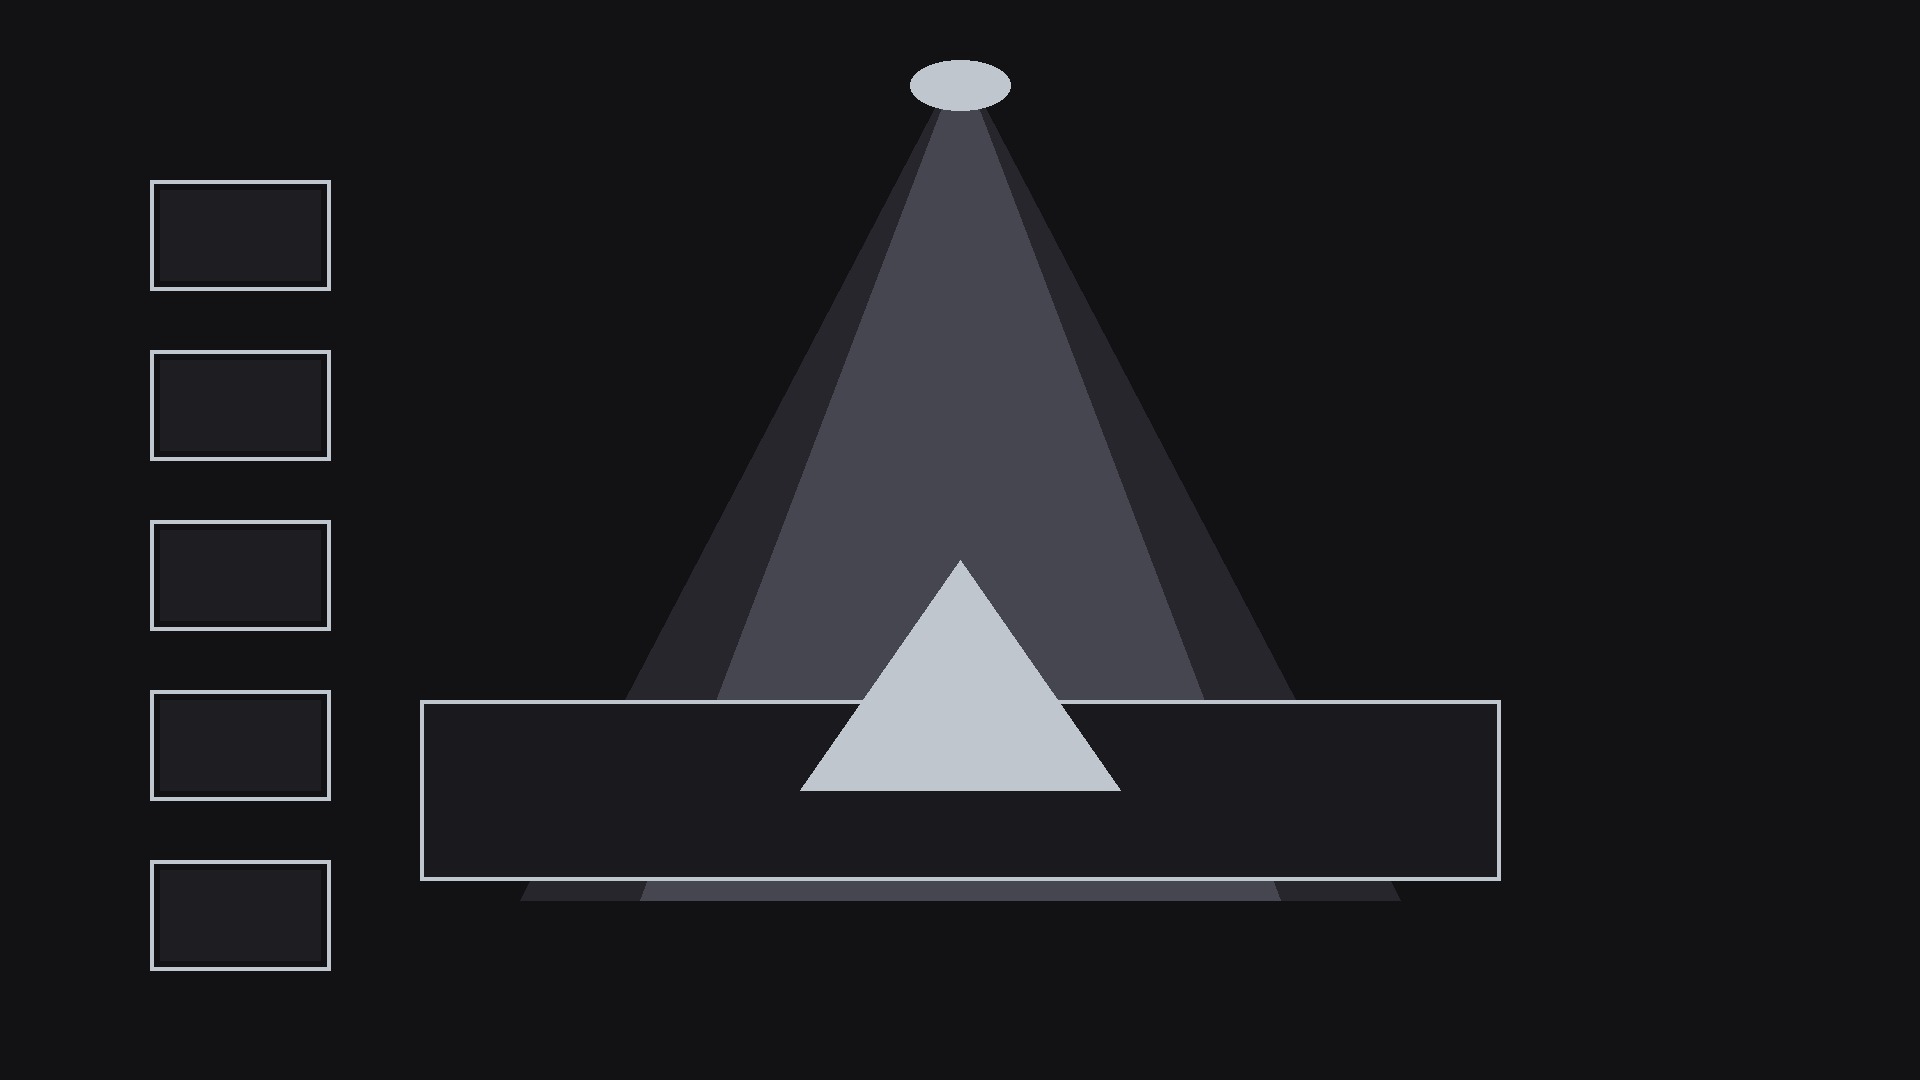
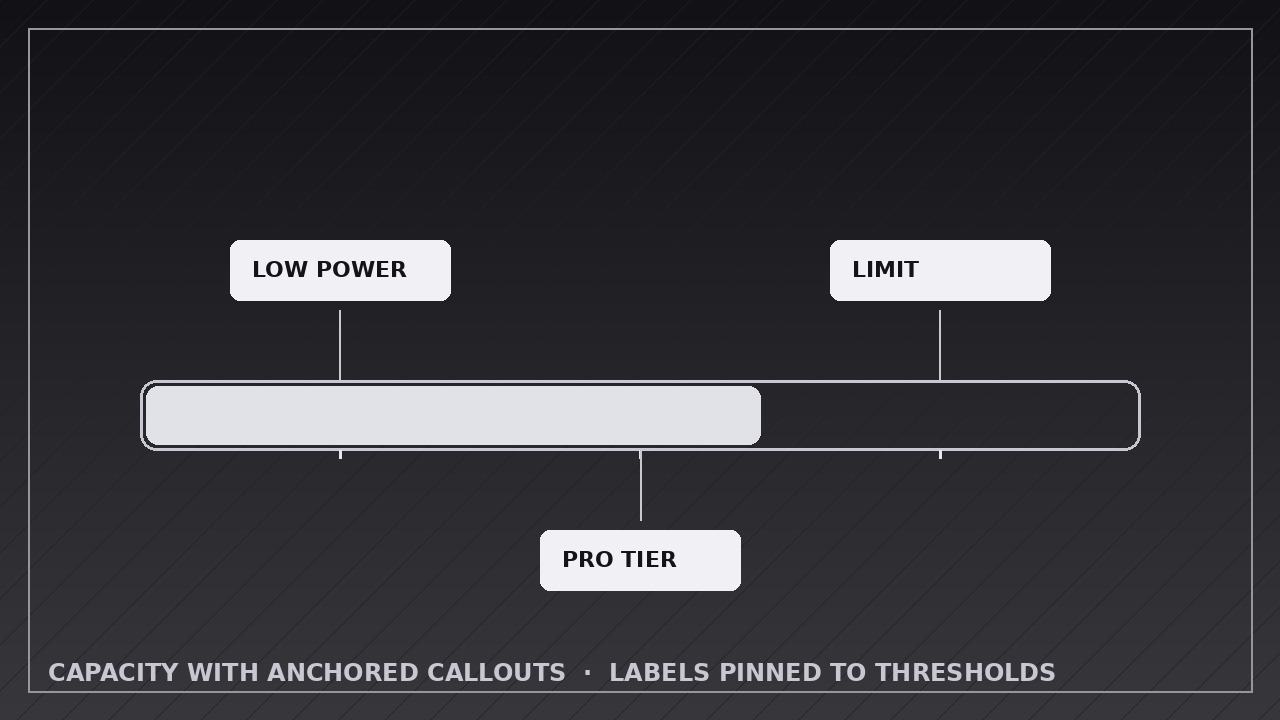
Capacity with Anchored Callouts
Threshold labels pop in exactly as the bar passes them.
Teaches your AI to build a capacity meter with fixed threshold ticks, where each callout pops in anchored to its mark the moment the fill reaches it — and stays for the final annotated frame.
Install it in 3 steps
No sign-up. No CLI tools. Pick your AI, copy one line, paste it over.
Prefer doing it yourself? Buy the skill ($4.99), download the ZIP from your checkout confirmation, unzip it into the directory shown above, restart your AI session — same result. Already bought it? Your AI assistant can download it for you.
What’s inside
One SKILL.md (the playbook) + one starter template. A preview:
Capacity with Anchored Callouts
When to use
- Explaining pricing or quota tiers: free up to X, pro up to Y, enterprise beyond Z, with each threshold labeled on the bar
- Showing a battery, storage, or budget meter where specific levels mean something ("low power mode at 20%")
- Walking through fundraising, campaign, or project progress with milestone markers along the way
- Teaching safe operating ranges: green zone, warning zone, danger zone, each anchored to its threshold
- Visualizing a journey with checkpoints: each threshold crossed unlocks a label or reward
- Comparing "where we are" against "where the thresholds sit" in a single glance
Workflow
- Define the thresholds (input: your scenario → output: threshold list with value, label, and meaning)
List every threshold in ascending order: its exact value (e.g. 20%, 50 GB, $10k), a short label of 1–4 words ("Low power", "Pro tier", "Stretch goal"), and one line on what happens at that threshold. Cap the list at 5 thresholds — more than that and the callouts crowd each other. Space check: at the final render size, adjacent threshold labels must not overlap when all are visible; if they do, merge or cut thresholds before animating. - Build the meter with anchor marks (input: threshold list → output: meter with fixed threshold ticks)
Build the bar with every threshold marked from the start: a tick line, a small dot or notch on the bar, and a faint value label. These anchor marks are static — they are the map the viewer reads before the bar moves. The bar's container, scale, and anchor marks never move during the animation; only the fill and the callouts animate. Hold this empty-but-marked state for 1 second so the viewer can read the map. - Fill toward the first threshold (input: marked meter → output: fill keyframes to threshold one)
Animate the fill from 0 to the first threshold over 1.0–1.5 seconds, ease-in-out, with a numeric readout tracking the fill exactly. The fill stops precisely at the threshold tick — not past it, not short of it. A fill that overshoots its threshold and slides back reads as a bug, so land on the tick.
Template preview
Capacity with Anchored Callouts — Animation Spec Template
Fill in the thresholds before animating. Ticks are visible from the start; callouts pop only as the fill touches each tick.
Meter: {what it measures — e.g. storage used, funding progress, budget spent}
Canvas: {1920×1080 / 1080×1080 / 1080×1920} | Frame rate: 30 fps | Export: H.264 Meter shape: {horizontal bar / vertical gauge} Final fill value: {value + unit — where the bar stops} Max thresholds: 5 | Callout placement: {all above / all below / alternating above-below}