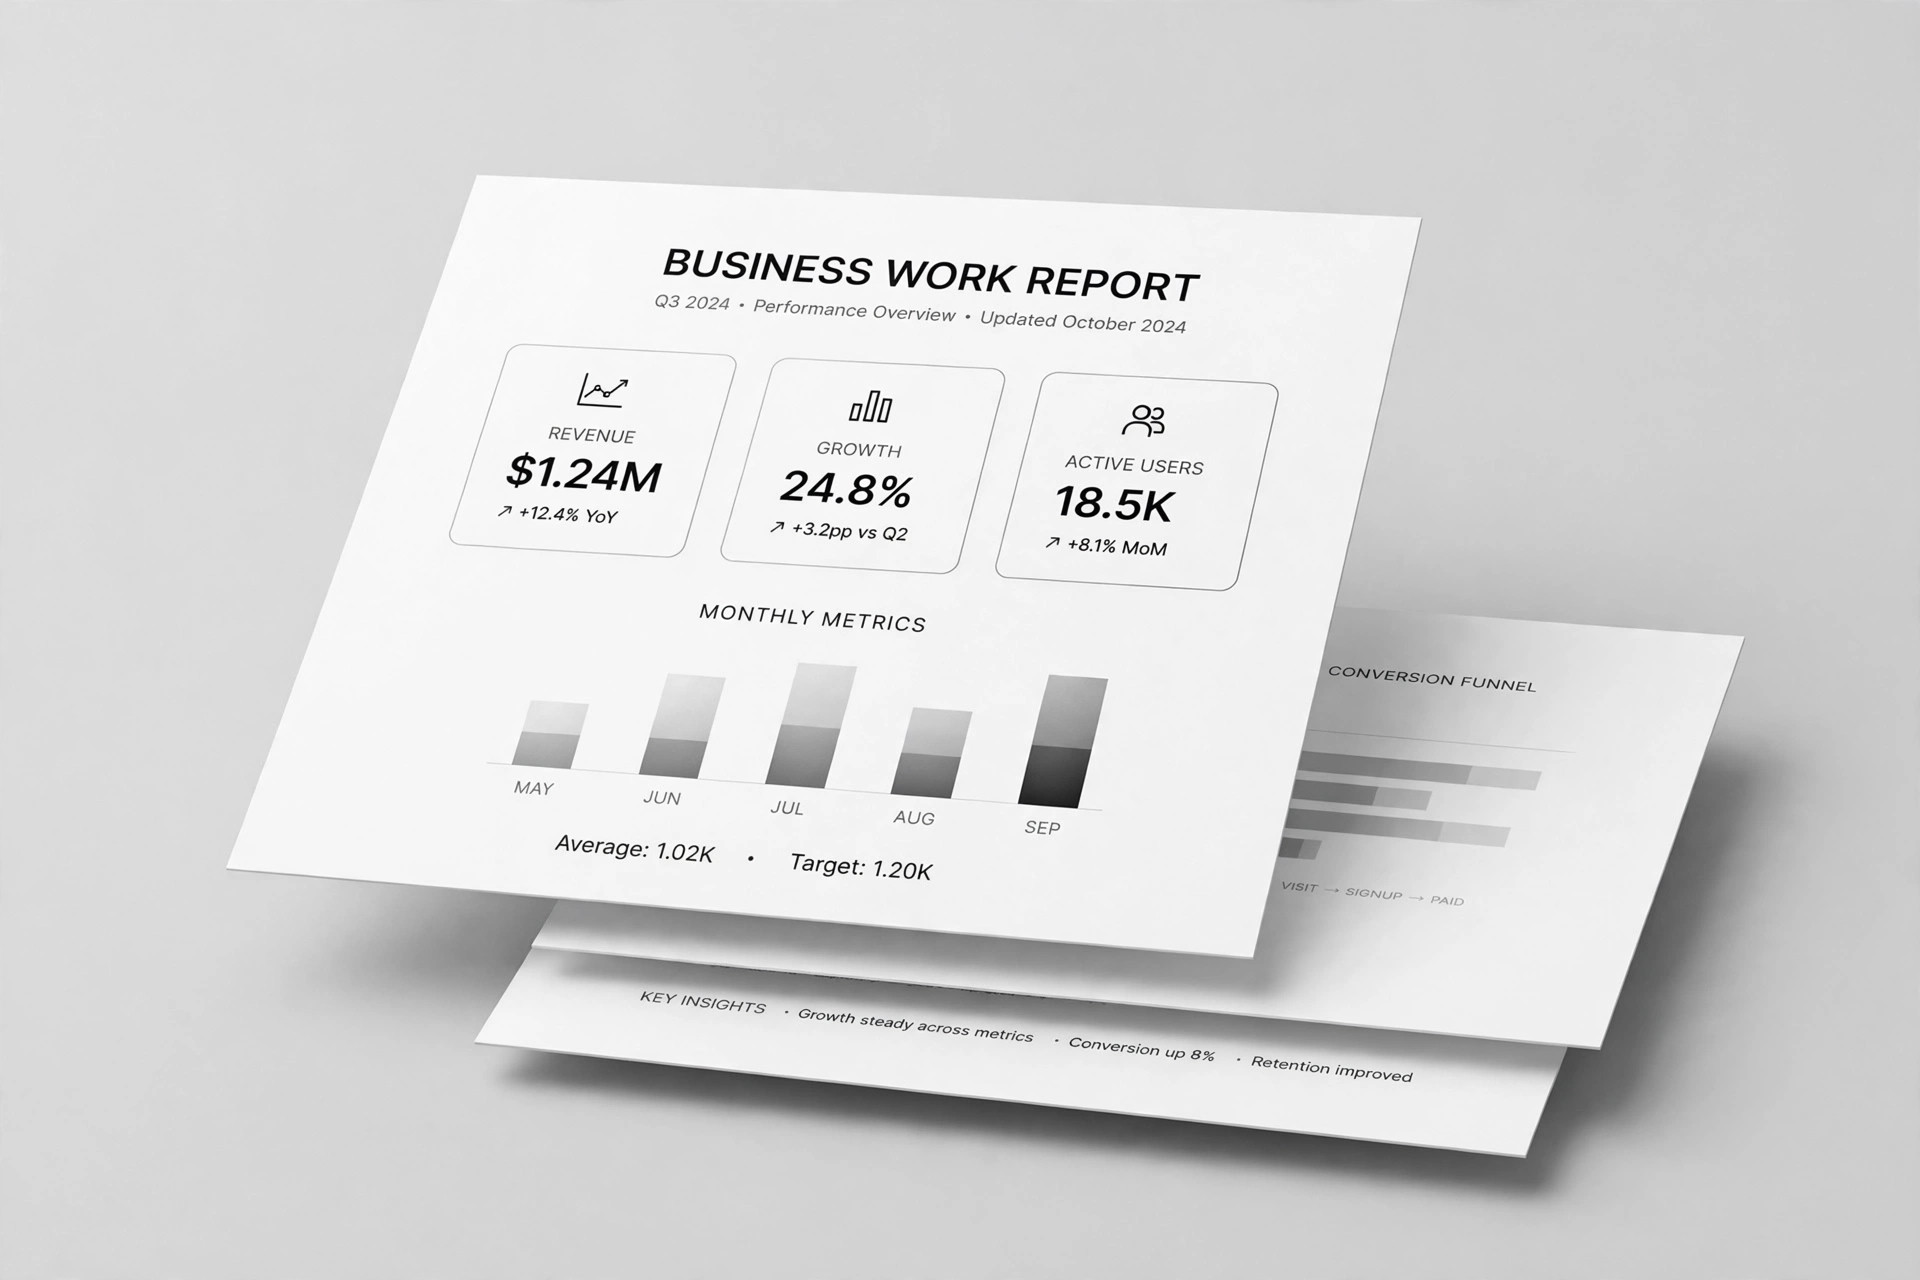
Slate Social Report Deck
A monthly report clients actually read
Builds a monthly social media report deck in a calm slate-gray style that shows what grew, what worked, and what to do next — with one story, one scoreboard, and no screenshot dumps.

Install it in 3 steps
No sign-up. No CLI tools. Pick your AI, copy one line, paste it over.
Prefer doing it yourself? Buy the skill ($4.99), download the ZIP from your checkout confirmation, unzip it into the directory shown above, restart your AI session — same result. Already bought it? Your AI assistant can download it for you.
What’s inside
One SKILL.md (the playbook) + one starter template. A preview:
Slate Social Report Deck
When to use
- You manage social accounts for a client and the monthly report is due — and last month's was a 40-slide screenshot dump
- Your agency needs one report format every account manager can fill in the same way
- A client keeps asking "so what did we actually get for the money?" and your report doesn't answer it
- You want to show a month of social performance to a non-technical stakeholder in under 10 minutes
- You're turning a one-off report into a repeatable monthly template
Workflow
- Gather the month (input: platform analytics exports → output: raw numbers table)
Pull the same set of numbers from every platform you report on: followers, reach, impressions, engagement (likes + comments + shares + saves), clicks, and conversions if tracked. Record this month and last month side by side, plus the goal if one was set. One table, one source of truth — no number appears in the deck unless it's in this table. If a platform changed its metric definitions, note it here so the deck doesn't compare apples to oranges. - Find the story (input: raw numbers table → output: 3-bullet story)
Before designing anything, answer three questions in plain sentences: What grew? (one line with the number) What worked? (the 1–3 posts or formats that drove the result, with why) What should change? (one concrete next step, not "post more"). If the month was flat or down, say so honestly and name the cause you can evidence — a dead format, a posting gap, a platform shift — not a vague "algorithm changes". The story decides which charts earn a slide; everything else stays in the appendix. - Build the deck (input: 3-bullet story → output: 8–10 slide deck)
Fixed structure, every month: ① Cover — client, month, one-line headline of the month ("Reach up 38%, driven by Reels") ② Scoreboard — 5–6 headline metrics with month-over-month change, big numbers, no chart junk ③ What grew — the single most important trend, one chart, one sentence ④ What worked — top 3 posts with thumbnails and the numbers that made them top ⑤ Platform breakdown — one row per platform, same metrics, so comparisons are honest ⑥ Audience — one slide: who engaged, any notable shift ⑦ Next month — 2–3 concrete actions with owners and dates ⑧ Appendix — the full numbers table for anyone who wants to audit. Ten slides max before the appendix; if it doesn't fit, it wasn't the story.
Template preview
Slate Social Report Deck — Template
One deck per client per month. Fill the numbers table first; the story comes from it; the slides follow.
Client: {name} · Month: {Month Year} · Prepared by: {name}
Raw numbers table (source of truth — every deck figure must match this)
Metric-definition changes this month: {none / platform X renamed Y — noted for comparability}
The story (write before designing)
What grew: {one line with the number} What worked: {1–3 posts/formats + why, with numbers} What changes: {one concrete next step}
Deck outline (8–10 slides + appendix)
- Cover — headline: "{Month} — {one-line result}"