Summary Line Chart
Eine Linie, ein Satz, kein Rauschen.
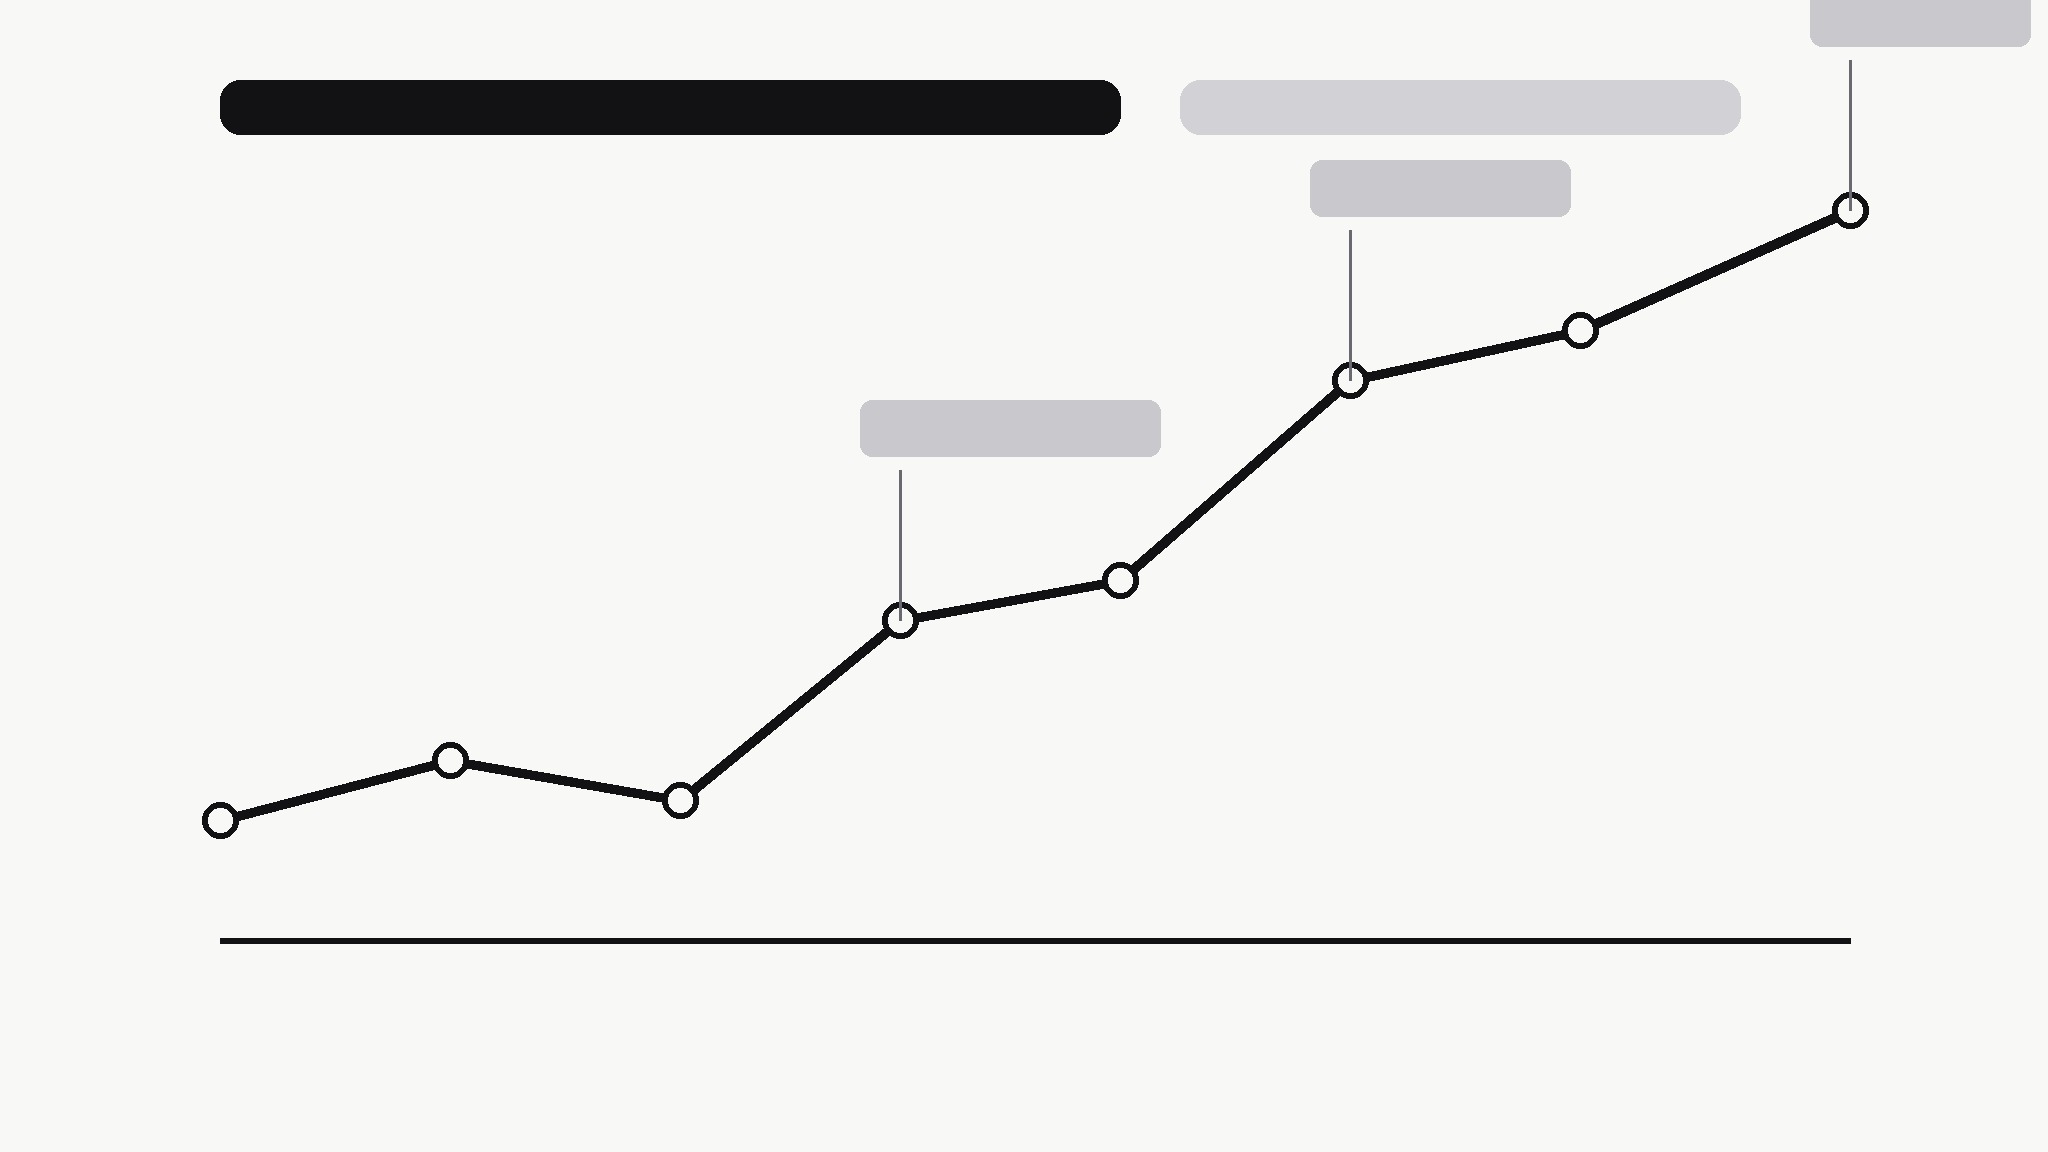
Verwandelt Ihre KI in einen Chart-Editor — verwandelt eine chaotische Zeitreihe in ein sauberes Liniendiagramm, das seine eigene Schlussfolgerung ausspricht, mit annotierten Wendepunkten und allem anderen entfernt.
In 3 Schritten installieren
Keine Anmeldung. Keine CLI-Tools. Wählen Sie Ihre AI, kopieren Sie eine Zeile und fügen Sie sie ein.
Lieber selbst machen? Kaufen Sie den Skill ($4.99), laden Sie die ZIP-Datei aus Ihrer Kaufbestätigung herunter, entpacken Sie sie in das oben angezeigte Verzeichnis und starten Sie Ihre AI-Sitzung neu — gleiches Ergebnis. Haben Sie ihn schon gekauft? Ihr AI-Assistent kann ihn für Sie herunterladen.
Was ist enthalten
Eine SKILL.md (die Anleitung) + eine Startvorlage. Eine Vorschau:
Summary Line Chart
When to use
- A report, deck, or post needs one chart that a reader can understand in five seconds without you standing next to it
- A time series has a story — growth, a drop, a recovery — but the raw chart buries it under gridlines, legends, and noise
- You're summarizing weekly or monthly numbers for people who don't read charts for a living
- A dashboard export shows everything and therefore communicates nothing; you need the one-line version
- You're comparing two periods and want the chart itself to say which way things moved and by how much
Workflow
- Find the one sentence (input: raw time series + context → output: chart headline)
Before touching any chart tool, write the sentence the chart must prove: "Sign-ups doubled after the March launch, then held steady." If you can't write that sentence, you don't have a chart yet — you have data to explore. The headline decides the time range, the annotations, and what gets cut. A chart without a sentence is decoration; a chart with one is an argument. - Clean the series (input: raw data → output: chart-ready series)
Pick one metric, one time range, and one granularity — daily noise becomes weekly totals, hourly spikes become daily averages. Fix gaps honestly: a missing week is a break in the line or a labelled gap, never a silently interpolated slope. Drop secondary series that don't serve the headline; if a second line is essential, it earns its place by changing the conclusion, not by adding context. - Draw the line (input: chart-ready series → output: bare chart)
One line, one color, minimal chrome: a light baseline, value labels only at the start, end, and turning points, no legend (the headline names the metric), no gridlines beyond the baseline. The line itself should carry the story — if the reader needs the axis labels to know whether things went up or down, the chart has failed at its one job. - Annotate the turning points (input: bare chart → output: annotated chart)
Mark at most three events on the line — the moments that explain the shape: launch, outage, price change, campaign. Each annotation is a date plus ≤6 words, placed so it never covers the line. Everything else is trivia for the appendix. If you can't name three events, mark fewer; an unannotated honest chart beats a chart decorated with guesses about why the line moved. - Check the takeaway (input: annotated chart → output: publish-ready chart)
Show the chart to someone who hasn't seen the data and ask one question: "What happened?" If their answer matches your headline sentence, ship it. If they hedge, squint, or answer a different question, the headline, the range, or the annotations are wrong — fix the chart, not the reader. Export at a size that stays sharp in its real home (slide, doc, or feed), and keep the source data linked so the number can be re-checked.
Vorschau der Startvorlage
Summary Line Chart — Template
One chart, one sentence. Write the sentence first; draw the line second.
Metric: {what is measured} — {time range}
Headline (the sentence the chart must prove): {e.g. Sign-ups doubled after the March launch, then held steady.}
Series
- Metric (one only): {e.g. weekly new sign-ups}
- Time range: {start} → {end}
- Granularity: {daily / weekly / monthly} — why: {reason}
- Data source: {file / link — keep it linked for verification}
Gaps and cleaning
- Gaps in the data: {none / list them — how shown: break in line / labelled gap}
- Series dropped (didn't serve the headline): {list or "none"}
Das Skill-Paket selbst (SKILL.md + Vorlage) ist auf Englisch verfasst.