Slate Social Report Deck
Un rapport mensuel que les clients lisent vraiment
Crée une présentation de rapport mensuel réseaux sociaux dans un style gris ardoise apaisé qui montre ce qui a grandi, ce qui a marché et ce qu'il faut faire ensuite — avec une histoire, un tableau de bord et aucun dump de captures d'écran.

Installez-la en 3 étapes
Sans inscription. Sans outils en ligne de commande. Choisissez votre IA, copiez une ligne, collez-la.
Vous préférez le faire vous-même ? Achetez la compétence ($4.99), téléchargez le ZIP depuis votre confirmation d'achat, décompressez-le dans le répertoire indiqué ci-dessus, redémarrez votre session IA — même résultat. Vous l'avez déjà achetée ? Votre assistant IA peut la télécharger pour vous.
Contenu du pack
Un fichier SKILL.md (le guide pratique) + un modèle de départ. Aperçu :
Slate Social Report Deck
When to use
- You manage social accounts for a client and the monthly report is due — and last month's was a 40-slide screenshot dump
- Your agency needs one report format every account manager can fill in the same way
- A client keeps asking "so what did we actually get for the money?" and your report doesn't answer it
- You want to show a month of social performance to a non-technical stakeholder in under 10 minutes
- You're turning a one-off report into a repeatable monthly template
Workflow
- Gather the month (input: platform analytics exports → output: raw numbers table)
Pull the same set of numbers from every platform you report on: followers, reach, impressions, engagement (likes + comments + shares + saves), clicks, and conversions if tracked. Record this month and last month side by side, plus the goal if one was set. One table, one source of truth — no number appears in the deck unless it's in this table. If a platform changed its metric definitions, note it here so the deck doesn't compare apples to oranges. - Find the story (input: raw numbers table → output: 3-bullet story)
Before designing anything, answer three questions in plain sentences: What grew? (one line with the number) What worked? (the 1–3 posts or formats that drove the result, with why) What should change? (one concrete next step, not "post more"). If the month was flat or down, say so honestly and name the cause you can evidence — a dead format, a posting gap, a platform shift — not a vague "algorithm changes". The story decides which charts earn a slide; everything else stays in the appendix. - Build the deck (input: 3-bullet story → output: 8–10 slide deck)
Fixed structure, every month: ① Cover — client, month, one-line headline of the month ("Reach up 38%, driven by Reels") ② Scoreboard — 5–6 headline metrics with month-over-month change, big numbers, no chart junk ③ What grew — the single most important trend, one chart, one sentence ④ What worked — top 3 posts with thumbnails and the numbers that made them top ⑤ Platform breakdown — one row per platform, same metrics, so comparisons are honest ⑥ Audience — one slide: who engaged, any notable shift ⑦ Next month — 2–3 concrete actions with owners and dates ⑧ Appendix — the full numbers table for anyone who wants to audit. Ten slides max before the appendix; if it doesn't fit, it wasn't the story. - Design in slate (input: deck structure → output: styled slides)
The slate system: light slate-gray background (#f1f5f9 range), near-black slate text, white cards for numbers and charts, one accent color per platform (kept consistent month to month) plus one neutral accent for highlights. One chart per slide, one message per chart — title the chart with its conclusion ("Reels drove 61% of reach"), never with its metric name ("Reach by format"). Numbers at 48px+ on the scoreboard; body text never below 16px. Every slide carries the client name, month, and page number in the footer so a forwarded screenshot stays attributable. - Review and send (input: styled deck → output: client-ready report)
Check every number against the raw table — one wrong figure costs more trust than a late deck. Read the deck as the client would: does the cover headline match the scoreboard? Does "what worked" name real posts? Does "next month" contain actions someone could actually do? Export as PDF (fonts embedded, under 10MB) and send with a 3-line email summary: the headline, the one thing that worked, the one thing changing. Keep the editable source — next month is a refill, not a rebuild.
Aperçu du modèle
Slate Social Report Deck — Template
One deck per client per month. Fill the numbers table first; the story comes from it; the slides follow.
Client: {name} · Month: {Month Year} · Prepared by: {name}
Raw numbers table (source of truth — every deck figure must match this)
Metric-definition changes this month: {none / platform X renamed Y — noted for comparability}
The story (write before designing)
What grew: {one line with the number} What worked: {1–3 posts/formats + why, with numbers} What changes: {one concrete next step}
Deck outline (8–10 slides + appendix)
- Cover — headline: "{Month} — {one-line result}"
Le pack de compétence lui-même (SKILL.md + modèle) est rédigé en anglais.
Vous aimerez aussi
 Présentations
Pitch Deck
10 diapositives, une seule histoire — les investisseurs restent jusqu'à la dernière page
 Présentations
Work Report
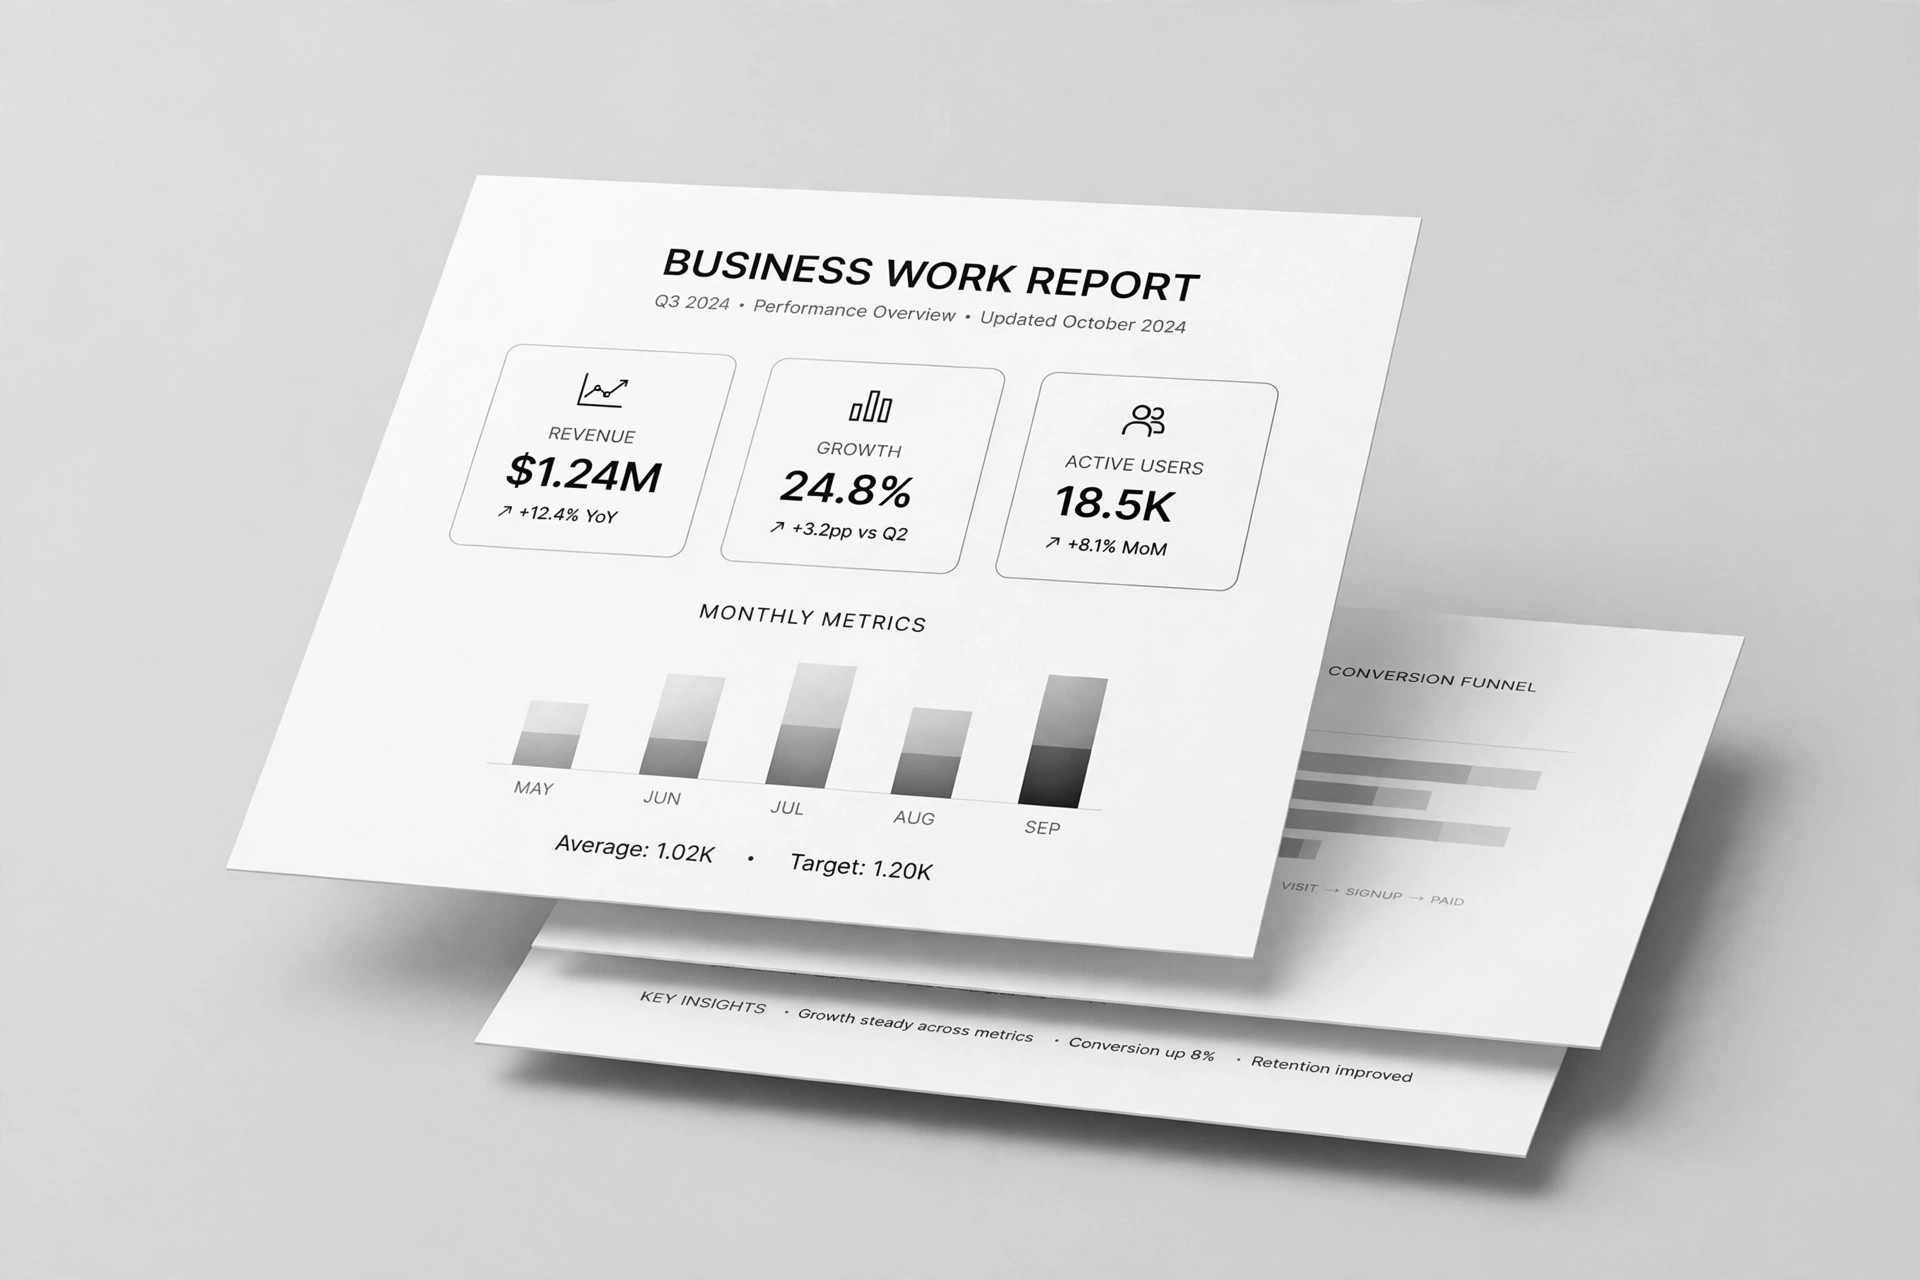
Hebdomadaire, mensuel, bilans — la conclusion d'abord, compris en 3 minutes
 Présentations
Academic Argument Deck
Une présentation qui argumente — et qui répond aux objections.