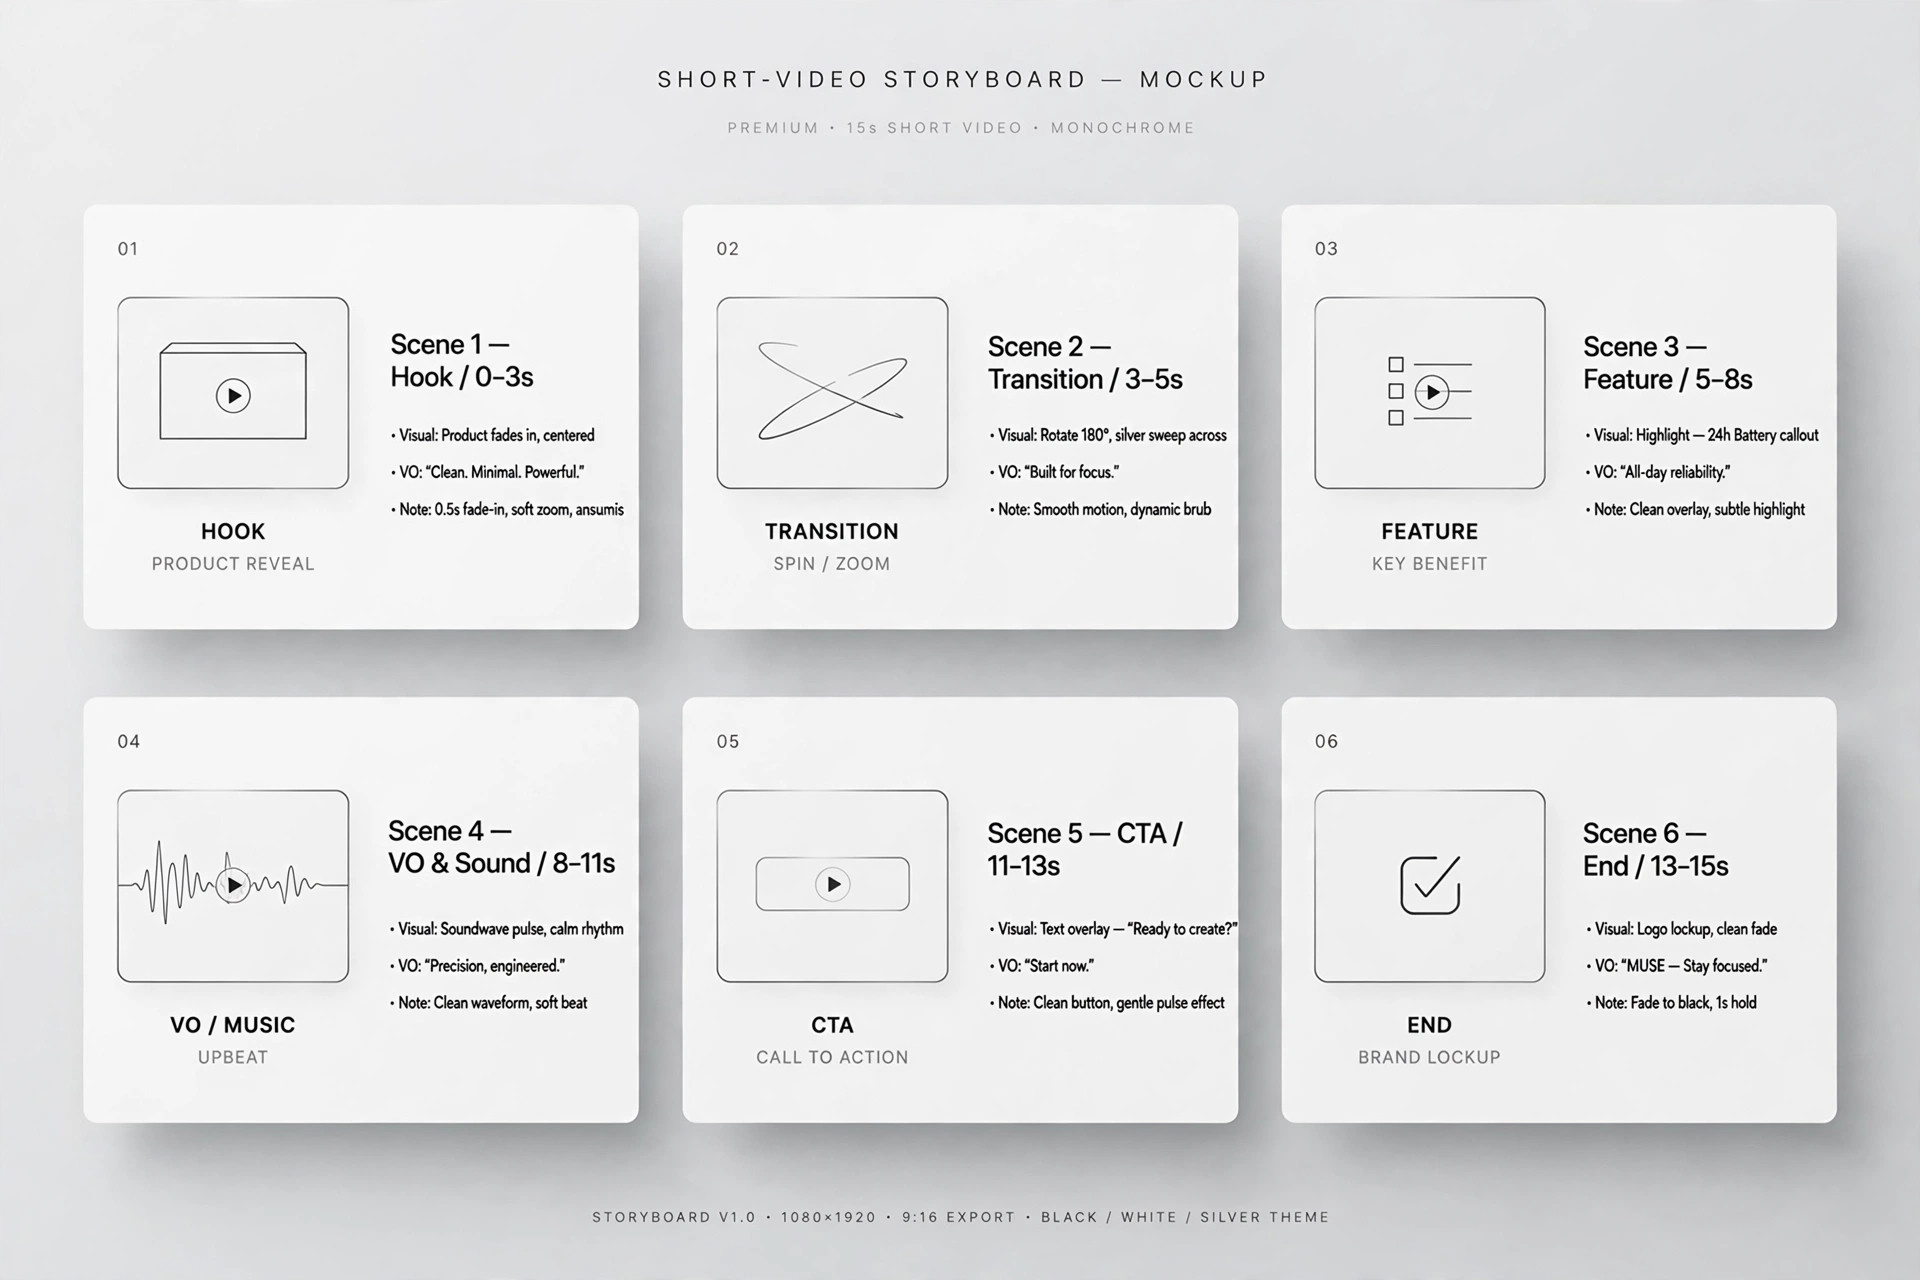
Sequential Bars
Les barres grandissent une à une jusqu’à ce que le classement se révèle
Transforme votre IA en réalisateur d’animations graphiques pour le motif des barres séquentielles — il fait grandir un ensemble de barres de données les unes après les autres avec un décalage régulier, pour que le public voie un classement se former au lieu de décoder un graphique tout fait.
Installez-la en 3 étapes
Sans inscription. Sans outils en ligne de commande. Choisissez votre IA, copiez une ligne, collez-la.
Vous préférez le faire vous-même ? Achetez la compétence ($4.99), téléchargez le ZIP depuis votre confirmation d'achat, décompressez-le dans le répertoire indiqué ci-dessus, redémarrez votre session IA — même résultat. Vous l'avez déjà achetée ? Votre assistant IA peut la télécharger pour vous.
Contenu du pack
Un fichier SKILL.md (le guide pratique) + un modèle de départ. Aperçu :
Sequential Bars
When to use
- A data story reveals survey results, sales figures, or vote counts and wants the ranking to land as a sequence, not a static chart
- A pitch deck compares competitors on one metric and the winner should be revealed last
- A finance explainer walks through budget categories from smallest to largest
- A sports recap counts points per quarter and builds the comeback bar by bar
- Any chart where the order of reveal is itself the argument (worst → best, first → last, small → large)
Workflow
- Choose the data (input: dataset → output: 3–7 bars)
Pick one metric, 3–7 categories, values on a common scale. Sort deliberately: ascending (small → large) builds to a climax; descending (large → small) front-loads the winner and lets the rest fall away; ranked-by-story order serves a narrative (e.g. chronological). Never sort alphabetically — alphabetical order is the absence of a decision. Cap at 7 bars; beyond that the stagger drags and the chart becomes wallpaper. If you have more categories, fold the tail into an "Other" bar and say so on screen. - Set the frame (input: bars → output: chart frame)
Draw the axis and baseline first, with gridlines at 0/25/50/75/100% of max value (light, 1px, 20% opacity — gridlines are scaffolding, not content). Bars sit on a common baseline, equal width, gaps of ~40% of bar width. Labels go under each bar (≤2 words) and values go at the bar's end, not inside the bar — inside-bar values get clipped by the growth animation. Leave 10% headroom above the tallest bar for the value label and a small "winner" marker if one comes. - Grow the bars in sequence (input: chart frame → output: growth animation)
Grow bars one at a time, in the chosen order, over 0.5–0.7s per bar with a 0.15–0.25s stagger between starts (total 1.5–3.5s for 5 bars). Each bar grows from the baseline with ease-out — fast start, decelerating settle — and lands with a 1-frame 102% overshoot that settles back over 0.1s. The value label counts up from 0 to the final value during the growth (linear count, same duration) and locks in with the overshoot. Bars that have already landed stay perfectly still while the next one grows; the audience should be able to point at "the bar that is moving" at any instant. - Mark the story (input: grown chart → output: annotation beat)
Once all bars have landed, hold 0.5s, then mark the point: highlight the key bar (brighten to full accent colour, others drop to 70% saturation), and add a one-line annotation (≤8 words: "2× the runner-up", "Only category that fell") with a thin leader line to the bar. The annotation fades in over 0.4s. One annotation only — a chart with three callouts is a report, not a moment. - Hold and exit (input: annotated chart → output: clean exit)
Hold the finished chart 2–3s so viewers can read the full ranking. Exit by fading the whole chart out over 0.4s, or by cutting to a close-up of the key bar for the next beat. Do not re-grow the chart for a second point — if the next beat needs a different metric, build a second chart; re-growing the same bars reads as a replay glitch.
Aperçu du modèle
Sequential Bars — Template
One metric, one deliberate order, bars that grow in sequence.
The data
Metric: {what is measured, units} Sort order: {ascending — small → large / descending — large → small / story order: {explain}} Categories (3–7):
Tail folded into "Other": {categories / none} Key bar (the story): #{n} — {label}
Frame
Orientation: {vertical bars / horizontal bars} Axis: zero-based, linear, gridlines at 0/25/50/75/100% (1px, 20% opacity) Bar width / gap: equal width, gaps ~40% of bar width Labels: under each bar (vertical) / left of bars (horizontal) Values: at bar ends, count up 0 → final during growth
Le pack de compétence lui-même (SKILL.md + modèle) est rédigé en anglais.