Spectrum Monitor Chart
Rangos, bandas y estado: legible en cinco segundos.
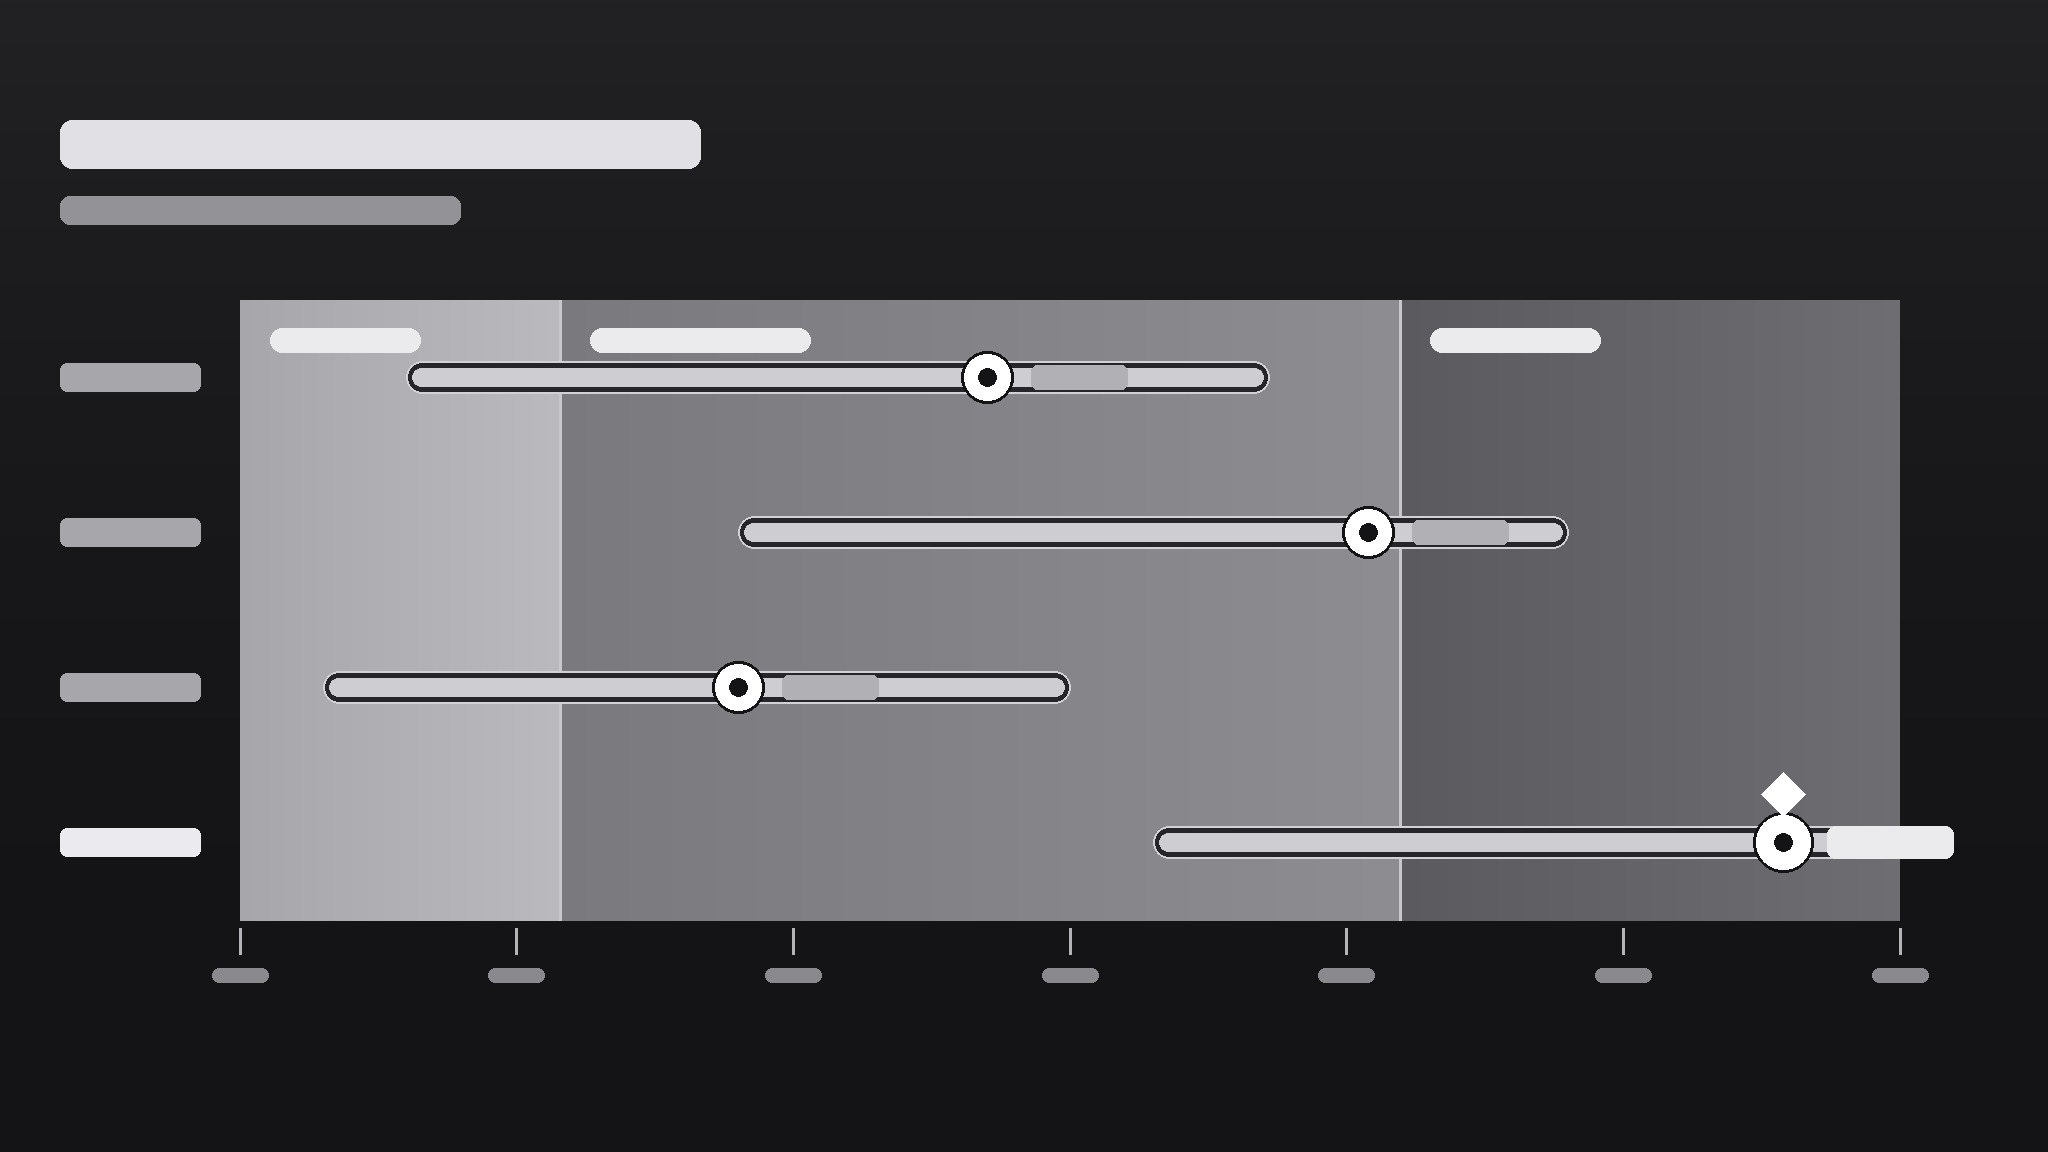
Convierte tu IA en diseñadora de gráficos de monitoreo de espectro: barras de rango sobre un eje en degradado que muestran dónde están las cosas, cuánto se dispersan y qué cuenta como normal, para que un vistazo te diga lo que una tabla nunca podría.
Instálala en 3 pasos
Sin registro. Sin herramientas CLI. Elige tu IA, copia una línea y pégala.
¿Prefieres hacerlo tú mismo? Compra la habilidad ($4.99), descarga el ZIP desde la confirmación de compra, descomprímelo en el directorio que se muestra arriba y reinicia tu sesión de IA — el mismo resultado. ¿Ya la compraste? Tu asistente de IA puede descargarla por ti.
Qué incluye
Un SKILL.md (la guía paso a paso) + una plantilla inicial. Una vista previa:
Spectrum Monitor Chart
When to use
- You need to show a range (low–high) and a current value against it — prices, temperatures, readings, benchmarks
- A dashboard needs a compact visual that says "this value is inside / outside the healthy band" at a glance
- You're comparing several items on the same scale and a bar chart would hide the spread
- A report needs a visual that non-technical readers can read without a legend tutorial
- You want one chart type that works for monitoring — readings that update over time against fixed bands
Workflow
- Define the scale and the bands (input: metric + healthy/expected range → output: axis with labeled bands)
Set the axis min and max from the data's real extremes (plus a small margin), then mark the bands that matter: e.g., low / normal / high, or below-target / on-target / above-target. Each band gets a label and a color step on a single gradient (light → strong), not a rainbow. If a reader can't say what each band means without asking you, relabel until they can. - Pick what each row shows (input: items to monitor → output: one row per item with value + range)
One row per item: a dot or marker for the current value, a bar for the observed range (min–max), and the band background behind both. Sort rows by something meaningful — current value, distance from target, or alphabetical — and say which in the chart note. Rows that show only a single number with no range don't belong here; that's a bar chart's job. - Encode status without shouting (input: rows + bands → output: marker colors and callouts for out-of-band items)
The marker's position already says most of it: inside the band = fine, outside = attention. Use a single accent (a darker marker or a small flag) for out-of-band rows only; everything else stays quiet. If half the chart is flagged, the bands are wrong, not the data — recalibrate the bands before adding more flags. - Label directly, keep the legend tiny (input: chart draft → output: labeled chart with axis ticks + unit note)
Put values next to markers ("24.6°C"), band labels inside the bands, and the unit once in the axis title. Axis ticks: 4–6 evenly spaced numbers, no more. A spectrum chart should be readable in five seconds by someone who has never seen one; if it needs a paragraph of explanation, simplify the chart, not the reader. - Check it updates cleanly (input: finished chart → output: chart + update checklist)
For a monitor chart, the design must survive new data: confirm the axis doesn't need rescaling every update, bands stay fixed unless the definition of "normal" genuinely changed, and out-of-band flags appear automatically from the rule, not by hand-editing. Write the update rule down ("flag when marker leaves the normal band for two consecutive readings") so the next person updates it the same way.
Vista previa de la plantilla
Spectrum Monitor Chart — Template
One metric, one axis, one glance. Fill this in before drawing the chart.
Metric
Metric: {e.g. warehouse temperature, server response time, unit price} Unit: {e.g. °C, ms, $} Source + period: {where the numbers come from, e.g. sensor log, this week}
Axis + bands
Axis min: {real data extreme − small margin} Axis max: {real data extreme + small margin} Axis title: {metric + unit, e.g. "Warehouse temperature (°C)"}
Band source: {who defined "normal" — e.g. published spec, team agreement, regulation}
Rows (one per item)
Row sort order: {by current value / by distance from target / alphabetical}
Labels
El paquete de la habilidad (SKILL.md + plantilla) está escrito en inglés.